- genevb's home page
- Posts
- 2025
- 2024
- 2023
- 2022
- September (1)
- 2021
- 2020
- 2019
- December (1)
- October (4)
- September (2)
- August (6)
- July (1)
- June (2)
- May (4)
- April (2)
- March (3)
- February (3)
- 2018
- 2017
- December (1)
- October (3)
- September (1)
- August (1)
- July (2)
- June (2)
- April (2)
- March (2)
- February (1)
- 2016
- November (2)
- September (1)
- August (2)
- July (1)
- June (2)
- May (2)
- April (1)
- March (5)
- February (2)
- January (1)
- 2015
- December (1)
- October (1)
- September (2)
- June (1)
- May (2)
- April (2)
- March (3)
- February (1)
- January (3)
- 2014
- December (2)
- October (2)
- September (2)
- August (3)
- July (2)
- June (2)
- May (2)
- April (9)
- March (2)
- February (2)
- January (1)
- 2013
- December (5)
- October (3)
- September (3)
- August (1)
- July (1)
- May (4)
- April (4)
- March (7)
- February (1)
- January (2)
- 2012
- December (2)
- November (6)
- October (2)
- September (3)
- August (7)
- July (2)
- June (1)
- May (3)
- April (1)
- March (2)
- February (1)
- 2011
- November (1)
- October (1)
- September (4)
- August (2)
- July (4)
- June (3)
- May (4)
- April (9)
- March (5)
- February (6)
- January (3)
- 2010
- December (3)
- November (6)
- October (3)
- September (1)
- August (5)
- July (1)
- June (4)
- May (1)
- April (2)
- March (2)
- February (4)
- January (2)
- 2009
- November (1)
- October (2)
- September (6)
- August (4)
- July (4)
- June (3)
- May (5)
- April (5)
- March (3)
- February (1)
- 2008
- 2005
- October (1)
- My blog
- Post new blog entry
- All blogs
Run 20 injection run test...again
Updated on Fri, 2020-03-13 23:04. Originally created by genevb on 2020-03-13 22:45.
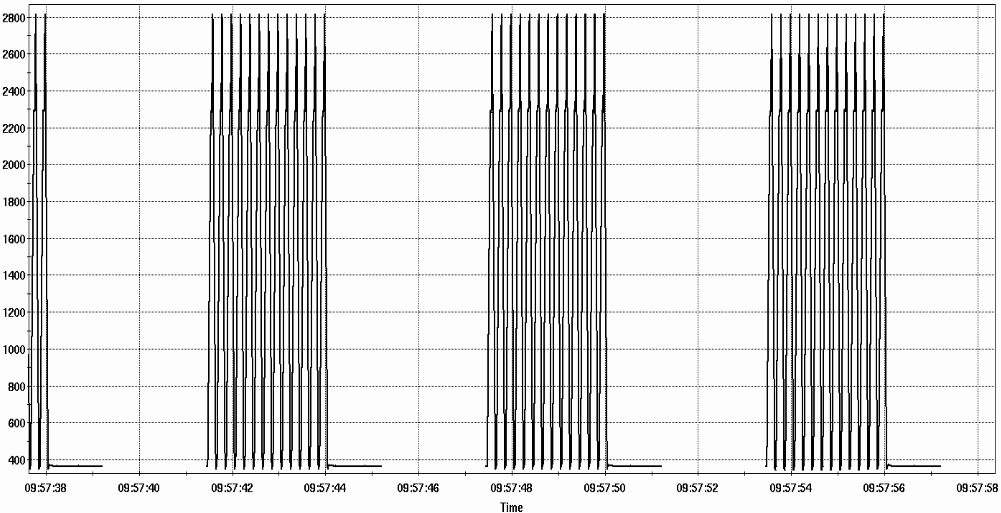
I was asked to again check whether injection runs are problematic for STAR with this year's operation of the collider (see this blog post for Run 19 observations). So run 21073029 is a AuAu9.2 run taken after yellow injection, during blue injection specifically for this test. Last year, I found that 6 bunches were injected into RHIC each 150 ms, so the process took about 750 ms and was repeated every 6.6 seconds. However, I saw no 6.6-second pattern this year, so I went back to the Booster Main Magnet currents and found that now it appears to be 13 magnet pulses for injection into RHIC each 200 ms, though I don't know if they're actually putting beam into all of the 13 pulses. So the 13 pulses take about 2.4 seconds, and repeat every 6.0 seconds this year.
Here is the plot of BMM currents zoomed in on a just a few sets of pulses. Time is in EDT.

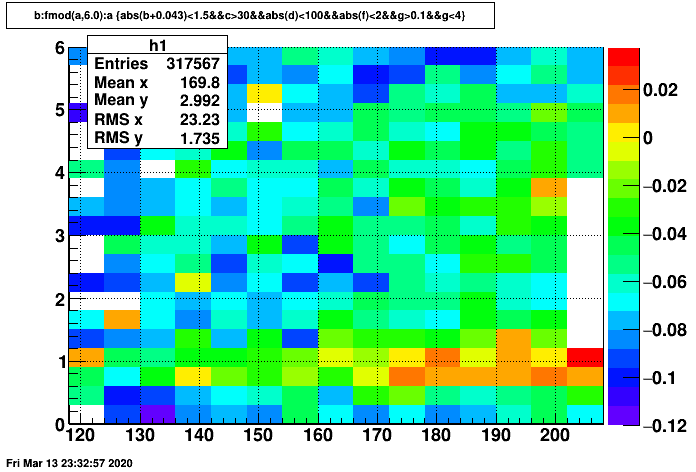
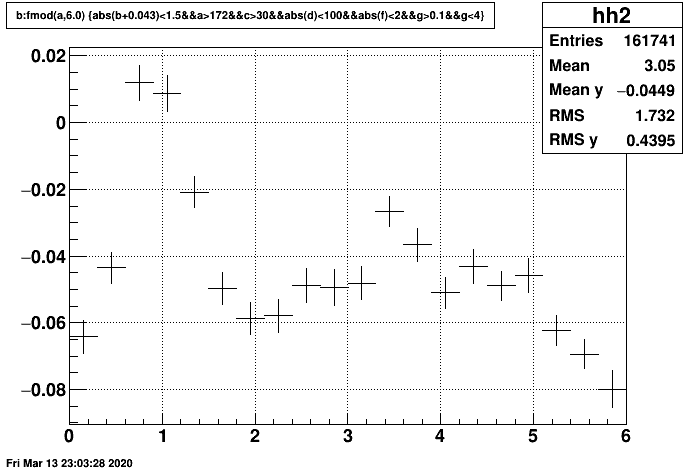
Using 6.0 for the cycle time makes it easy to see the sDCA distortions caused by the injection. Below or profiles of the sDCA of global tracks to the highest ranked primary vertex. On the left, it is <sDCA> [cm] vs. time in 6.0-second cycle [sec] vs. time in run [sec], and on the right it is <sDCA> [cm] vs. time in 6.0-second cycle [sec]. Cuts on the left include Nhits>30, |η|<2, |Vz|<100 cm, 0.1 < pT < 4.0 GeV/c, |sDCA+0.043| < 1.5 cm. The plot on the right has the same cuts, plus time in run > 172 seconds.


The conclusion is that distortions at the ~0.1 cm scale are evident from the injection, which is at a level for which we should still be concerned, even if a little smaller than last year. Further, the distortion changes with time in the run, likely making it even more difficult to appropriately model. We should avoid taking such runs.
-Gene
Here is the plot of BMM currents zoomed in on a just a few sets of pulses. Time is in EDT.

Using 6.0 for the cycle time makes it easy to see the sDCA distortions caused by the injection. Below or profiles of the sDCA of global tracks to the highest ranked primary vertex. On the left, it is <sDCA> [cm] vs. time in 6.0-second cycle [sec] vs. time in run [sec], and on the right it is <sDCA> [cm] vs. time in 6.0-second cycle [sec]. Cuts on the left include Nhits>30, |η|<2, |Vz|<100 cm, 0.1 < pT < 4.0 GeV/c, |sDCA+0.043| < 1.5 cm. The plot on the right has the same cuts, plus time in run > 172 seconds.


The conclusion is that distortions at the ~0.1 cm scale are evident from the injection, which is at a level for which we should still be concerned, even if a little smaller than last year. Further, the distortion changes with time in the run, likely making it even more difficult to appropriately model. We should avoid taking such runs.
-Gene
»
- genevb's blog
- Login or register to post comments
