- genevb's home page
- Posts
- 2025
- 2024
- 2023
- 2022
- September (1)
- 2021
- 2020
- 2019
- 2018
- 2017
- December (1)
- October (3)
- September (1)
- August (1)
- July (2)
- June (2)
- April (2)
- March (2)
- February (1)
- 2016
- November (2)
- September (1)
- August (2)
- July (1)
- June (2)
- May (2)
- April (1)
- March (5)
- February (2)
- January (1)
- 2015
- December (1)
- October (1)
- September (2)
- June (1)
- May (2)
- April (2)
- March (3)
- February (1)
- January (3)
- 2014
- 2013
- 2012
- 2011
- January (3)
- 2010
- February (4)
- 2009
- 2008
- 2005
- October (1)
- My blog
- Post new blog entry
- All blogs
Sti/CA/HR Time Comparisons
Updated on Tue, 2017-07-18 17:04. Originally created by genevb on 2017-07-18 17:04.
Using some of the log files from the PWG test samples, and grep'ing the log files for the fraction of the chain time spent in Sti, I get the following results on the relative speed of Sti, StiCA, and StiHR on identical data (but not processed on identical nodes)...
Because the nodes are not identical, the CPU time in seconds is not a reliable metric. Fraction of time spent in the tracking is better, but not perfect as the time not spent in tracking has components that are also dependent on the number of tracks found, and thus may also be correlated with the time spent in tracking. The following two sets of 12 plots thus use the following two quantities:
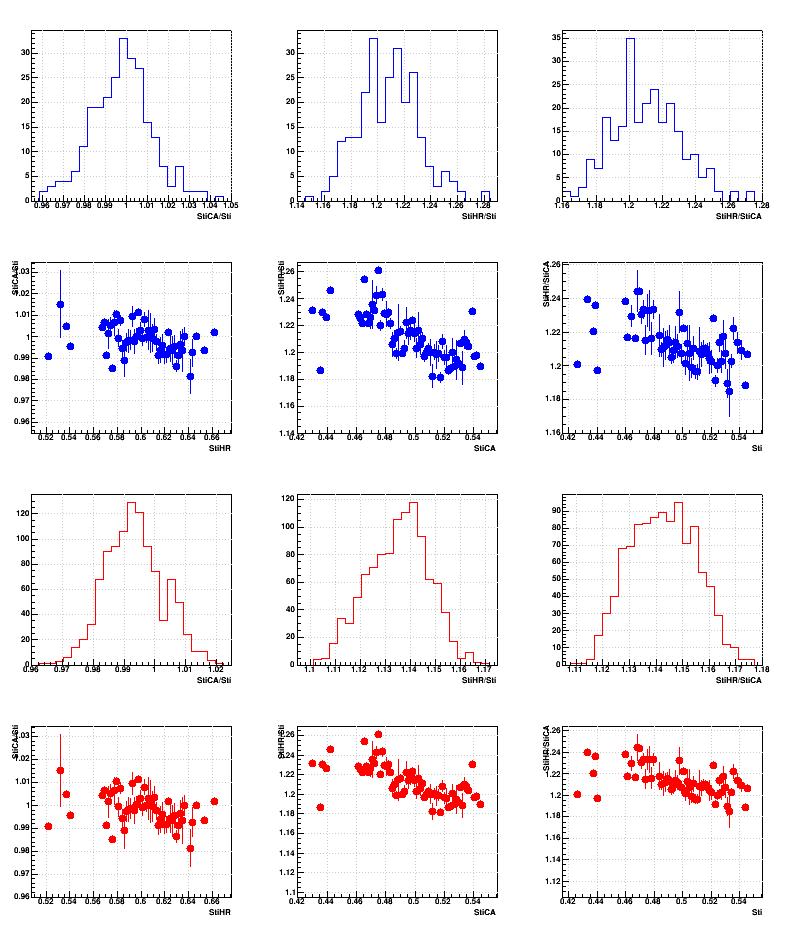
First set: ttracking / tbfc
Second set: ttracking / (tbfc - ttracking)
Within each set, the three columns are StiCA/Sti, StiHR/Sti, and StiHR/StiCA. The four rows are the distributions of those ratios in the first and third rows for Run 11 in blue and Run 16in red. respectively; the second and fourth rows show the profile of those distributions versus the unused (third) quantity as a proxy for the multiplicity (i.e. does any ratio depend on the multiplicity).
First set:
Second set:
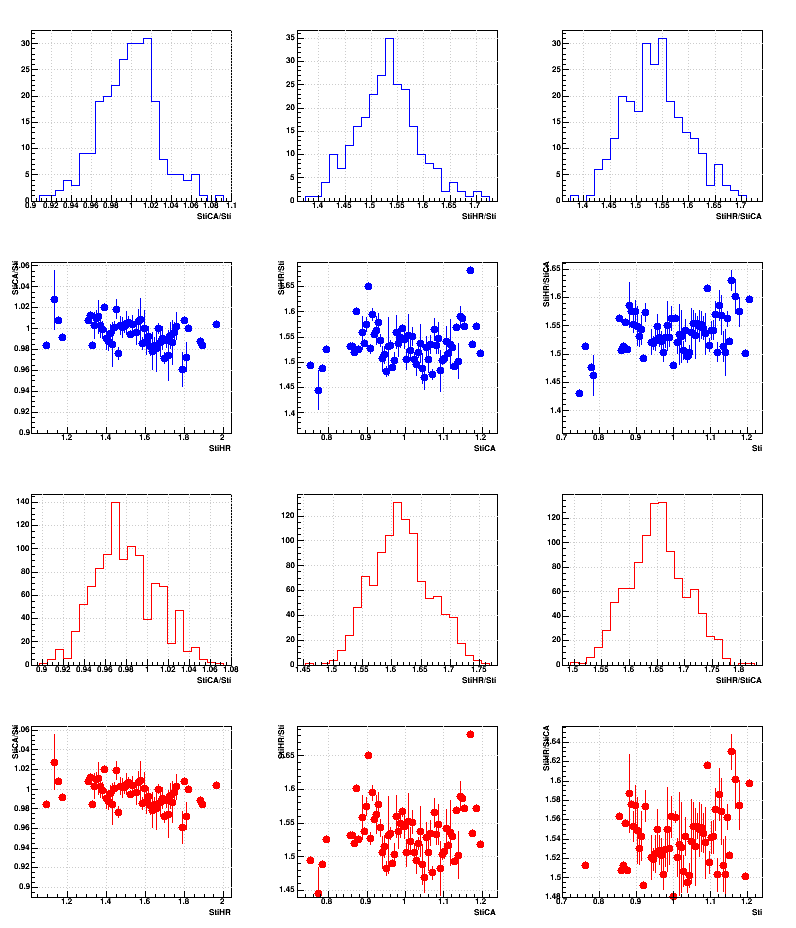
So the truth is probably even a little bit higher ratios for StiHR/Sti and StiHR/StiCA than shows up in the second set of plots. And while there may be some dependence of the ratios on multiplicity, they are not strong dependences.
-Gene
Because the nodes are not identical, the CPU time in seconds is not a reliable metric. Fraction of time spent in the tracking is better, but not perfect as the time not spent in tracking has components that are also dependent on the number of tracks found, and thus may also be correlated with the time spent in tracking. The following two sets of 12 plots thus use the following two quantities:
First set: ttracking / tbfc
Second set: ttracking / (tbfc - ttracking)
Within each set, the three columns are StiCA/Sti, StiHR/Sti, and StiHR/StiCA. The four rows are the distributions of those ratios in the first and third rows for Run 11 in blue and Run 16in red. respectively; the second and fourth rows show the profile of those distributions versus the unused (third) quantity as a proxy for the multiplicity (i.e. does any ratio depend on the multiplicity).
First set:
Second set:
So the truth is probably even a little bit higher ratios for StiHR/Sti and StiHR/StiCA than shows up in the second set of plots. And while there may be some dependence of the ratios on multiplicity, they are not strong dependences.
-Gene
»
- genevb's blog
- Login or register to post comments