- genevb's home page
- Posts
- 2025
- 2024
- 2023
- 2022
- September (1)
- 2021
- 2020
- 2019
- 2018
- 2017
- December (1)
- October (3)
- September (1)
- August (1)
- July (2)
- June (2)
- April (2)
- March (2)
- February (1)
- 2016
- November (2)
- September (1)
- August (2)
- July (1)
- June (2)
- May (2)
- April (1)
- March (5)
- February (2)
- January (1)
- 2015
- December (1)
- October (1)
- September (2)
- June (1)
- May (2)
- April (2)
- March (3)
- February (1)
- January (3)
- 2014
- 2013
- 2012
- 2011
- January (3)
- 2010
- February (4)
- 2009
- 2008
- 2005
- October (1)
- My blog
- Post new blog entry
- All blogs
Test on GL Wall voltages
Updated on Wed, 2020-07-01 14:28. Originally created by genevb on 2018-10-24 14:00.
This is a presentation of results for the GridLeak Wall voltage tests planned here and acquired here.
For these results, I included iTPC in tracking, and updated the SpaceCharge & GridLeak calibration code to be able to use it. I then zeroed the GridLeak distortion correction for sector 20. I turned on the Padrow 40 distortion correction, and turned off the Padrow 13 correction.
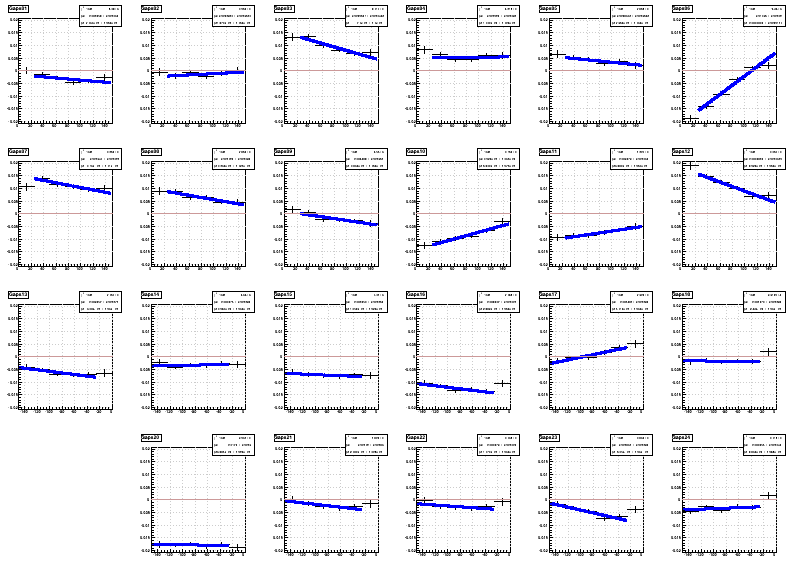
First, here are some example fits to the "Gaps" histogram sector-by-sector. I only fit over the range 25<|z|<150 cm because of lowered statistics outside that range, and some slight non-linearity at the ends (this is known from the distortion map). The linear fit gives the offset at |z|=205 cm (the projection of where the distortion map aims at zero distortion) and a slope. Sector 19 is absent because the RDO on the outer part of the inner sector (19-2) was turned off during the Run (this was during the isobar data).
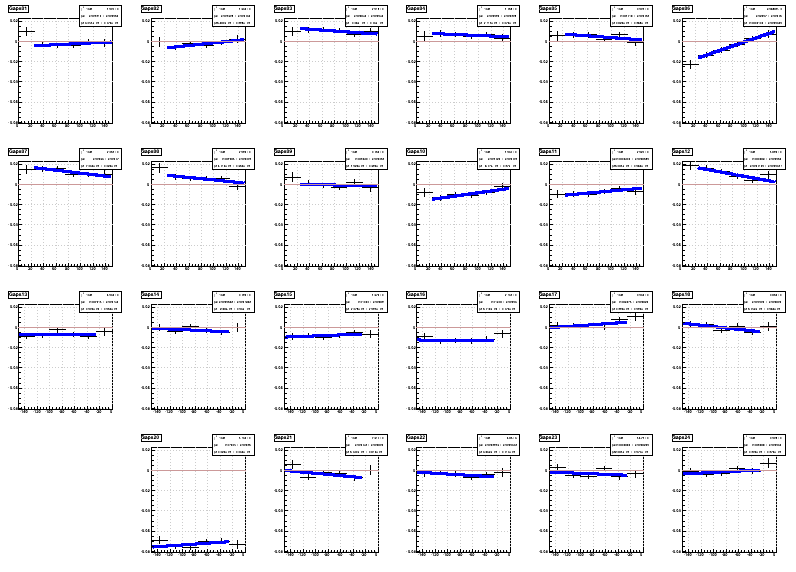
In this particular example, sector 20 shows a large offset, but its slope isn't too dissimilar to other sectors.
Offsets represent something at the endcap, such as alignment, or a static field distortion due to the expressed potential along the plane of the GG. The latter is supposedly compensated by the padrow 40 distortion correction, for which I have populated the database. However, it is clear here that it is not properly corrected.
Slopes represent something in the drift volume of the TPC: GridLeak.
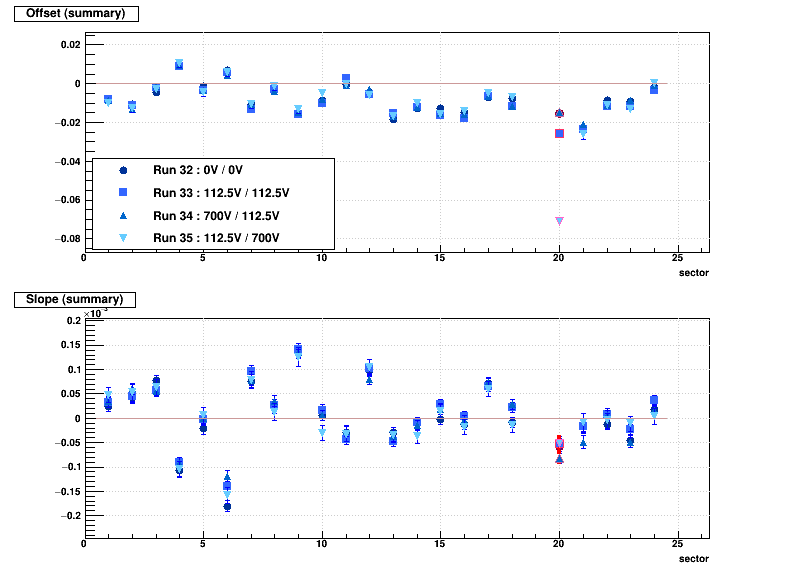
Here is a summary plot of offsets and slopes for the 4 acquired GL Wall Voltage runs that include iTPC and seem to have any statistics (19124032-035), using 10k events per run for this initial look:
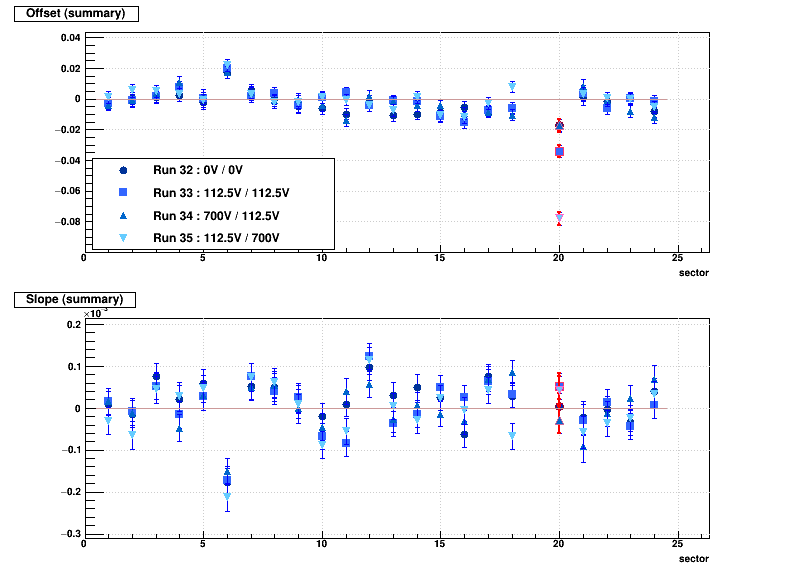
In this summary it becomes obvious that the static field distortion isn't being properly compensated in the iTPC sector 20. There may be some misalignment of the iTPC sector (and this is expected, as Yuri has done an alignment calibration that wasn't used here, so this is with old TPC alignment), but misalignment should be the same for all 4 runs so it cannot explain the variations between runs. Additionally, within the statistics used, there is no clear evidence of GridLeak in sector 20 from any of the 4 runs (the different GridLeak in sector 6 was a You do not have access to view this node, though we've done nothing about it in our productions yet). This gives me the following to-do items:
It is not apparent that anything improves, and sector 4 seems to be worse (it is clearly not a statistical fluctuation as all 4 runs systematically shift their slope, though I don't understand how it can develop the appearance of GridLeak just by changing the alignment). I'm not yet sure what to conclude from this.
I will anyhow try using both alignments with a larger statistics sample.
________________
UPDATE 2018-10-31:
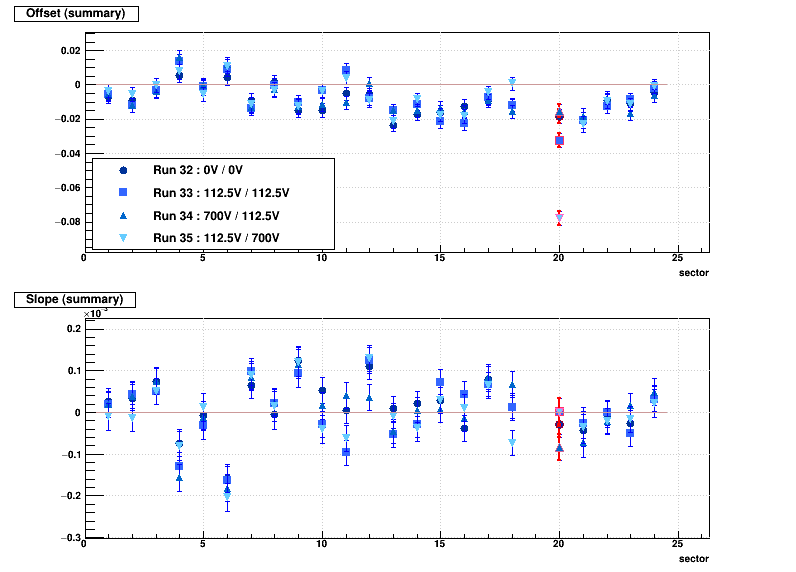
Here are high statistics versions of the above plots with old (first plot pair) and new (second plot pair) alignment.
Old alignment:
_______
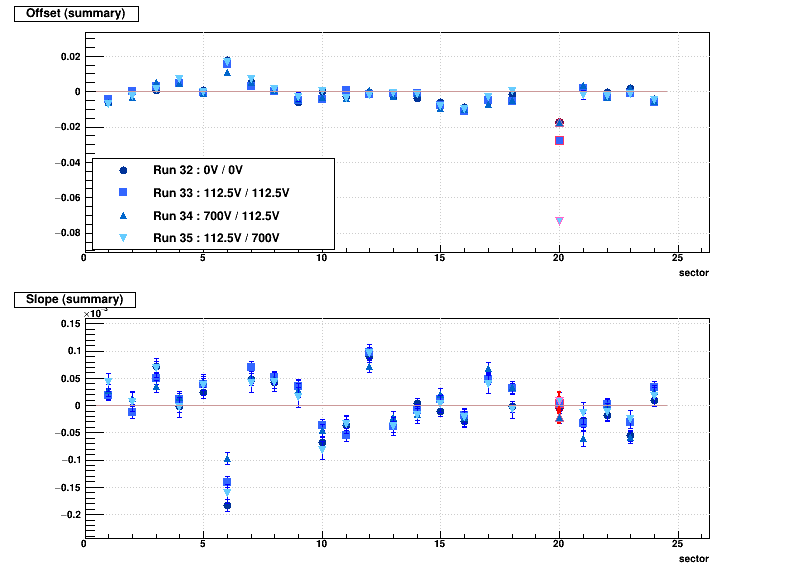
New alignment:
Not much new insight over the low statistics other than the increased dispersion with the new alignment, and sector 4 seems to gain a z dependence (slope). To be sure that's really the case, I made the sector-by-sector gaps vs. z plots for old (first plot group) and new (second plot group) alignment using run 19124032, clearly showing the change in slope for sector 4:
Old alignment:
_______
New alignment:
-Gene
For these results, I included iTPC in tracking, and updated the SpaceCharge & GridLeak calibration code to be able to use it. I then zeroed the GridLeak distortion correction for sector 20. I turned on the Padrow 40 distortion correction, and turned off the Padrow 13 correction.
First, here are some example fits to the "Gaps" histogram sector-by-sector. I only fit over the range 25<|z|<150 cm because of lowered statistics outside that range, and some slight non-linearity at the ends (this is known from the distortion map). The linear fit gives the offset at |z|=205 cm (the projection of where the distortion map aims at zero distortion) and a slope. Sector 19 is absent because the RDO on the outer part of the inner sector (19-2) was turned off during the Run (this was during the isobar data).
In this particular example, sector 20 shows a large offset, but its slope isn't too dissimilar to other sectors.
Offsets represent something at the endcap, such as alignment, or a static field distortion due to the expressed potential along the plane of the GG. The latter is supposedly compensated by the padrow 40 distortion correction, for which I have populated the database. However, it is clear here that it is not properly corrected.
Slopes represent something in the drift volume of the TPC: GridLeak.
Here is a summary plot of offsets and slopes for the 4 acquired GL Wall Voltage runs that include iTPC and seem to have any statistics (19124032-035), using 10k events per run for this initial look:
In this summary it becomes obvious that the static field distortion isn't being properly compensated in the iTPC sector 20. There may be some misalignment of the iTPC sector (and this is expected, as Yuri has done an alignment calibration that wasn't used here, so this is with old TPC alignment), but misalignment should be the same for all 4 runs so it cannot explain the variations between runs. Additionally, within the statistics used, there is no clear evidence of GridLeak in sector 20 from any of the 4 runs (the different GridLeak in sector 6 was a You do not have access to view this node, though we've done nothing about it in our productions yet). This gives me the following to-do items:
- Check these results using Yuri's new iTPC alignment.
- Process more statistics to see if anything becomes more clear on GridLeak.
It is not apparent that anything improves, and sector 4 seems to be worse (it is clearly not a statistical fluctuation as all 4 runs systematically shift their slope, though I don't understand how it can develop the appearance of GridLeak just by changing the alignment). I'm not yet sure what to conclude from this.
I will anyhow try using both alignments with a larger statistics sample.
________________
UPDATE 2018-10-31:
Here are high statistics versions of the above plots with old (first plot pair) and new (second plot pair) alignment.
Old alignment:
_______
New alignment:
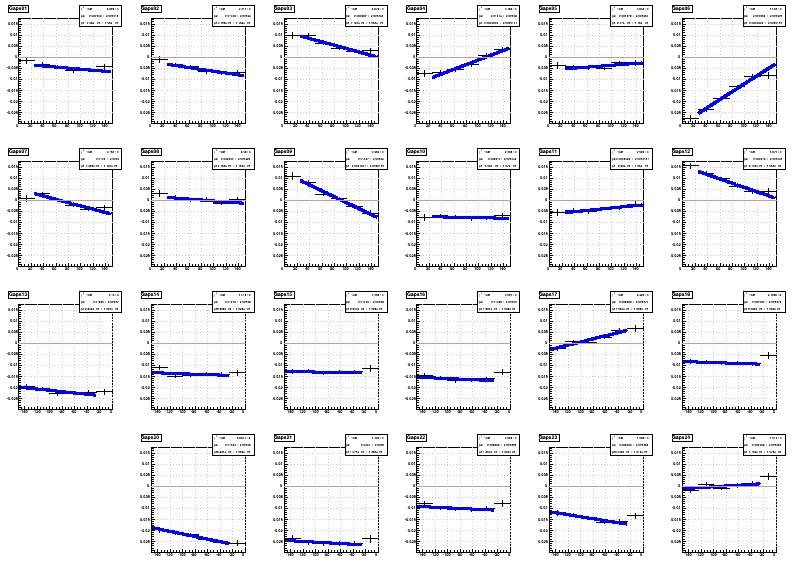
Not much new insight over the low statistics other than the increased dispersion with the new alignment, and sector 4 seems to gain a z dependence (slope). To be sure that's really the case, I made the sector-by-sector gaps vs. z plots for old (first plot group) and new (second plot group) alignment using run 19124032, clearly showing the change in slope for sector 4:
Old alignment:
_______
New alignment:
-Gene
»
- genevb's blog
- Login or register to post comments