- genevb's home page
- Posts
- 2025
- 2024
- 2023
- 2022
- September (1)
- 2021
- 2020
- 2019
- 2018
- 2017
- December (1)
- October (3)
- September (1)
- August (1)
- July (2)
- June (2)
- April (2)
- March (2)
- February (1)
- 2016
- November (2)
- September (1)
- August (2)
- July (1)
- June (2)
- May (2)
- April (1)
- March (5)
- February (2)
- January (1)
- 2015
- December (1)
- October (1)
- September (2)
- June (1)
- May (2)
- April (2)
- March (3)
- February (1)
- January (3)
- 2014
- 2013
- 2012
- 2011
- January (3)
- 2010
- February (4)
- 2009
- 2008
- 2005
- October (1)
- My blog
- Post new blog entry
- All blogs
TPC Lasers in Run 17
Updated on Wed, 2017-03-22 15:14. Originally created by genevb on 2017-03-22 15:07.
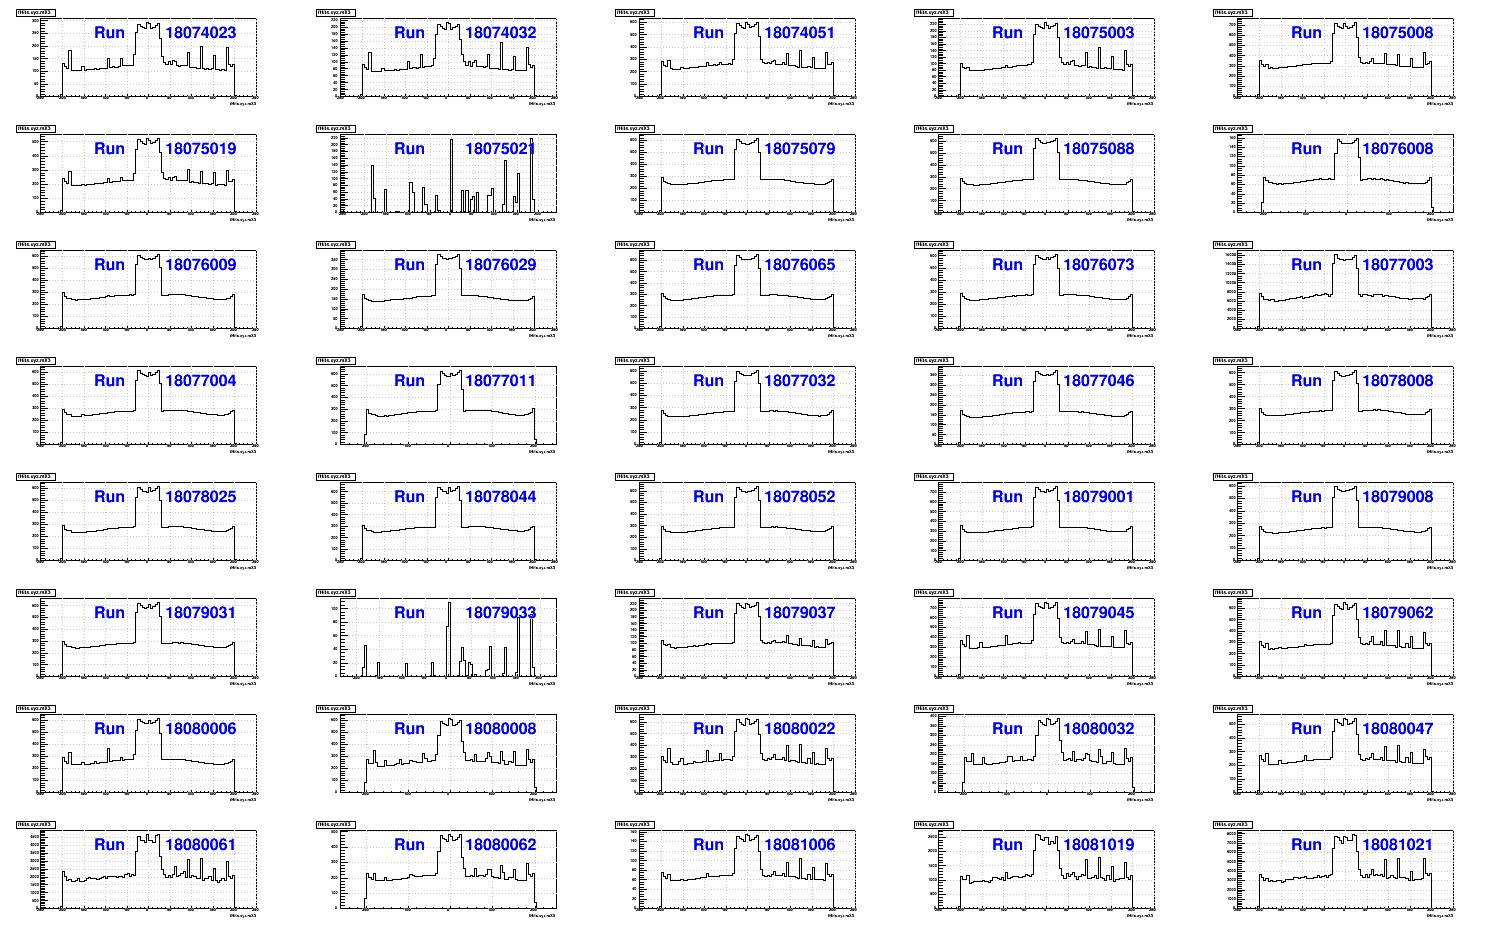
The following block of plots show the z position of TPC hits from laser data during days 74-81 of Run 17. One can see the following features:
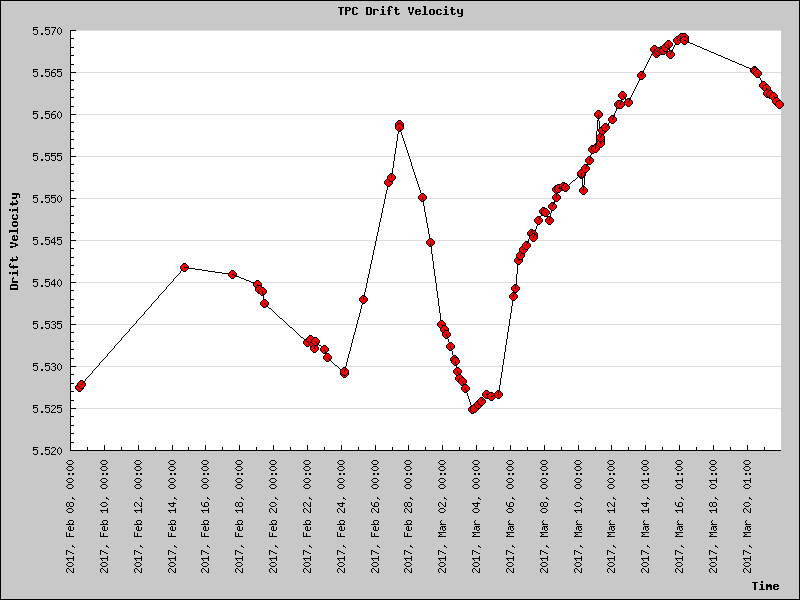
The absent laser data has led to failed drift velocity calibration jobs, and a gap in the drift velocity data in the middle of March (visible on the right side of the following plot):
This was discussed at today's TPC meeting.
-Gene
Here is the shell script I used to generate the plots of z hit positions:
- Lasers lead to peaks at specific z positions.
- The west side (z>0) lasers appear to have more signal than the east side lasers.
- There are numerous runs, particularly from 18075079 through 18079031, where no laser peaks are discernable.
- The laser runs without beam (laser_localclock) are obviated by the lack of collision backgrounds: 18075021 and 18079033.
The absent laser data has led to failed drift velocity calibration jobs, and a gap in the drift velocity data in the middle of March (visible on the right side of the following plot):
This was discussed at today's TPC meeting.
-Gene
Here is the shell script I used to generate the plots of z hit positions:
set rdir = /star/data10/calib/tpcDriftVelocity/runs

cd $rdir
set runs = `/bin/ls`
cd $owd
unset rstr
foreach run ($runs)
  mkdir $run
  cd $run
  ln -s ${rdir}/${run}/st*.laser.root .
  cd ..
  if ($?rstr) then
    set rstr = "${rstr},${run}"
  else
    set rstr = "$run"
  endif
end
@ nruns = $#runs
echo $nruns
echo $rstr

root -l << EOF
    int runs[${nruns}] = {${rstr}};
    gStyle->SetPalette(1);gStyle->SetGridColor(kGray);gStyle->SetOptDate(0);gStyle->SetOptStat(0);
    TCanvas c1("c1","plots",1500,1000);
    c1.Divide(5,8);
    TText aa;
    aa.SetTextSize(0.18);
    aa.SetTextColor(4);
    TChain laser("laser");
    for (int i=0; i<${nruns}; i++) {
      printf("Working on %d\n",runs[i]);
      laser.Add(Form("%d/st_laser_*.laser.root",runs[i]));
      c1->cd(i+1);
      laser.Draw("fHits.xyz.mX3");
      aa.DrawTextNDC(0.30,0.7,Form("Run         %d",runs[i]));
      laser.Reset();
    }
    c1->SaveAs("plot.png");
    .q
EOF
»
- genevb's blog
- Login or register to post comments