- genevb's home page
- Posts
- 2025
- 2024
- 2023
- 2022
- September (1)
- 2021
- 2020
- 2019
- 2018
- 2017
- December (1)
- October (3)
- September (1)
- August (1)
- July (2)
- June (2)
- April (2)
- March (2)
- February (1)
- 2016
- November (2)
- September (1)
- August (2)
- July (1)
- June (2)
- May (2)
- April (1)
- March (5)
- February (2)
- January (1)
- 2015
- December (1)
- October (1)
- September (2)
- June (1)
- May (2)
- April (2)
- March (3)
- February (1)
- January (3)
- 2014
- 2013
- 2012
- 2011
- January (3)
- 2010
- February (4)
- 2009
- 2008
- 2005
- October (1)
- My blog
- Post new blog entry
- All blogs
TPC prompt hit revelations in Run 19 AuAu19.6
Updated on Mon, 2020-10-05 16:17. Originally created by genevb on 2020-10-05 00:26.
I took a look at the reconstructed position in the time dimension (time bins) of prompt hits in the TPC to see what I could learn from over 300k events sampled from ~30 Run 19 19.6 GeV runs. For each event, I averaged the time bin position of hits in the prompt regions of the TPC (<time>) separately for inner east, outer east, inner west, and outer west. I also kept track of the number of hits used in the average, and the average padrow (<padrow>) of those hits as I figured there would be a time-of-flight dependence that I could encapsulate in <padrow>.
One necessary adjustment was that sectors 4, 10, and 24 seemed to be offset by 1 time bin and I subtracted 1.0 from their hits' time bin positions.
I made some additional cuts to exclude hits:
- Due to recent findings about biases in the position of merged clusters, I selected only hits with flag==0 (not merged).
- Dead regions on either half of the TPC could cause east vs. west asymmetries, so I excluded matching regions from the opposite half:
+ Dead sector:rows :: 4:11-24, 5:57-72, 10:21-40
+ Matching excluded regions :: 20:11-24, 19:57-72, 14:21-40
I then tried to introduce a time-of-flight correction for each of the 4 regions. The factors for east and west seemed close enough to use the same factor on both sides, but different factors for inner vs. outer. And then I applied an additional offset to put all 4 regions centered at 0 where their statistics were good (I wasn't careful to put the prompt hit peak or mean position at zero when I recorded the ntuple, and it was better to wait until this stage to determine the 0 after other cuts anyhow). This worked well except the inner west region, which seemed to show a region of very significant non-linearity at low <padrow> values. I did not come to an understanding of this effect, but it would be worth understanding at some point (side note: I observed the feature persisted for all days in my study). To avoid issues from this in my studies, I cut on <padrow> in the range [17.5,23.5] for the inner data where the linearity was good on both sides, thus excluding some events from my analysis. I also used cuts that each event in my analysis had >50 prompt hits in any region whose <time> was used in the plot, and |<time>| < 0.75 time bins.
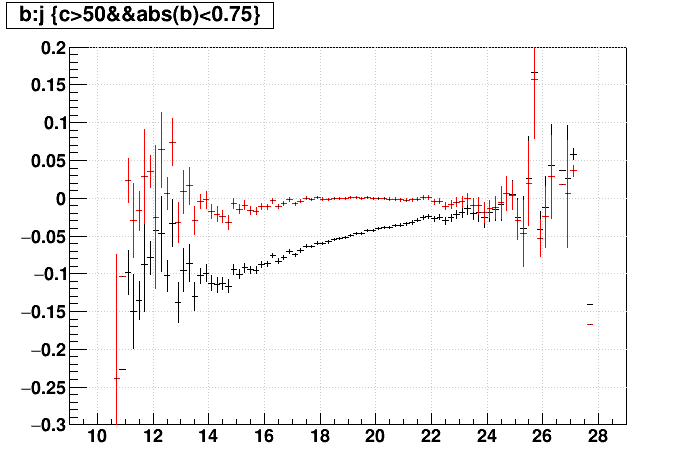
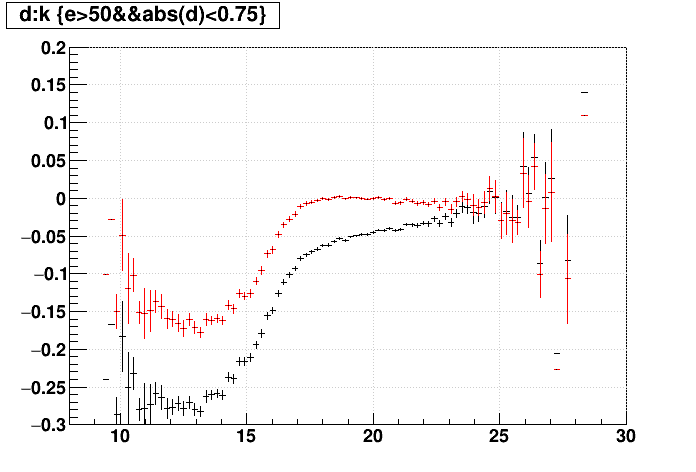
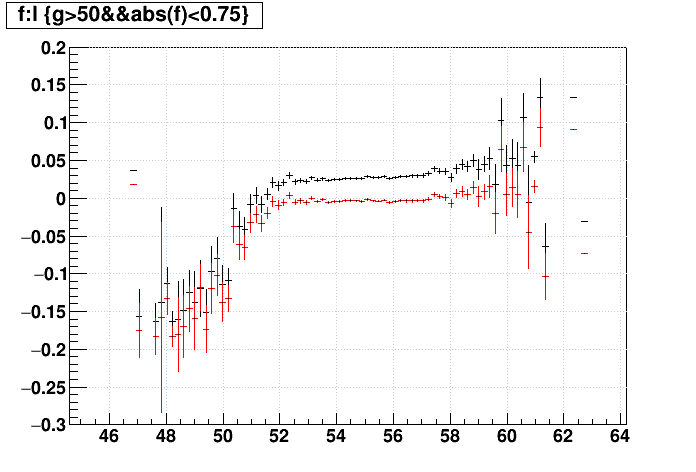
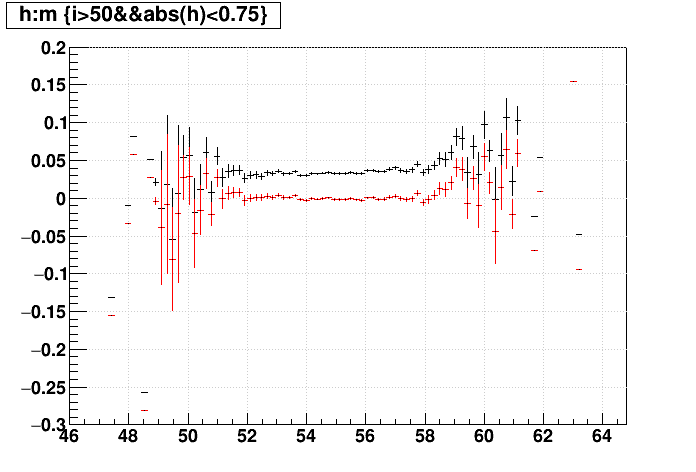
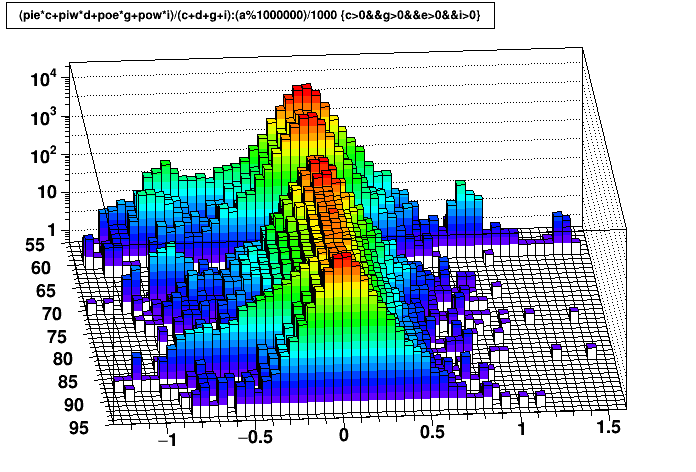
With these corrections in place, here are the distributions of inner <time> vs. outer <time> for the east, the west, and then both halves combined. The correlation is evident in all three, showing that there is some common dependence in the form of a varying overall global event T0. (NB: This particular group of plots does not have the cuts on <padrow> not <time>, and the cut on the number of prompt hits was reduced to >0.)
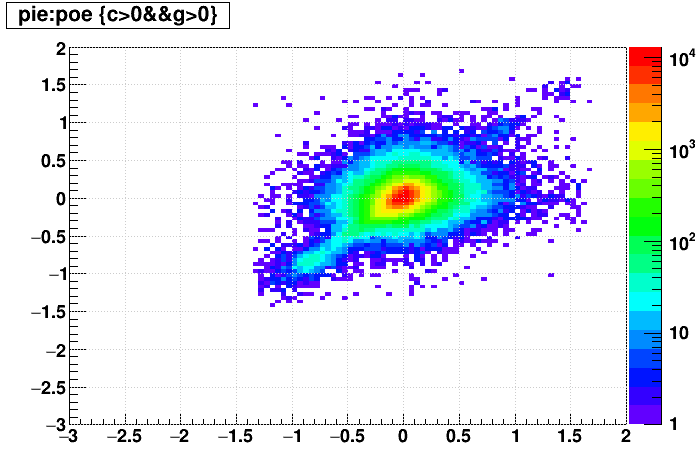
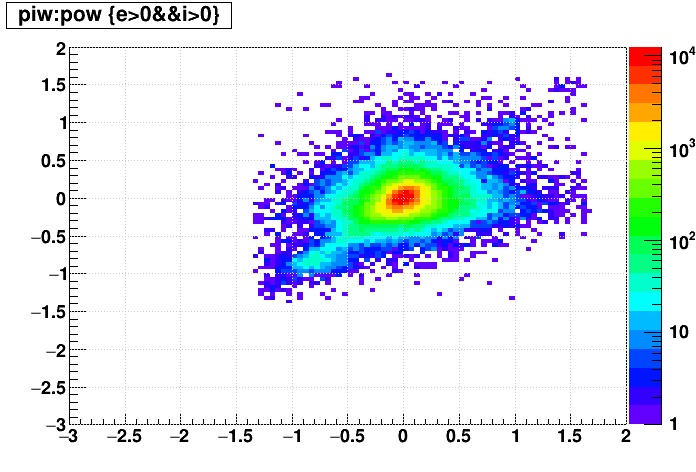
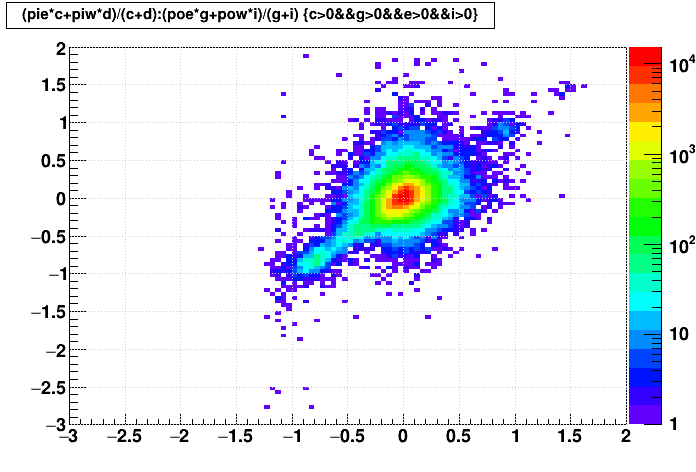
There is some evidence in the above plots (and the one to follow) of prompt hits that are from the previous and next collisions ±1 time bin away, diluted by a few prompt hits from the triggered event so that their peaks are a bit less than 1 full time bin away (and even a hint of the diluted +2 time bin). I should note that these hits from other bunch crossings are largely excluded from my study by cuts I had in selecting on the region of hits that I called "prompt" to a window of ~3 time bins total in the first place.
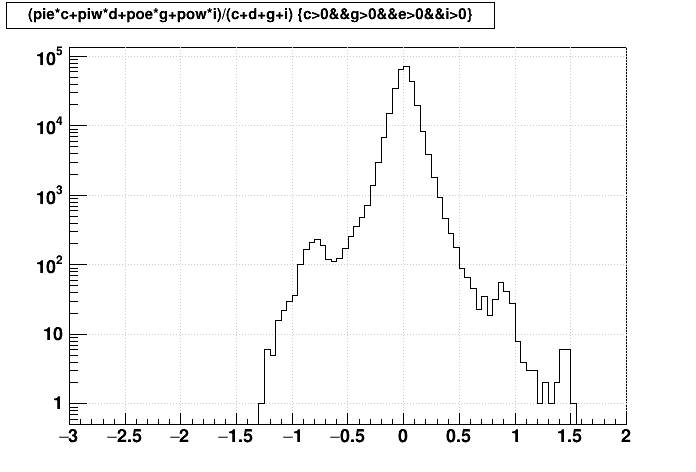
Below on the left is what I get for the distribution if I use all 4 regions to define a single <time> for each event (weighted by the number of hits for each region). On the right is that distribution plotted vs. day number of the runs I examined, where we can see that runs in the early days seemed to have more in the previous/next collision peaks, and also that run 20087007 (day 87) had a much more smeared <time> distribution (I checked in all 4 TPC regions), which I suspect is due to lots of beam ions slipping out of the desired RF buckets near the end of a fill if I understand the relevant ShiftLog entry properly. Otherwise, the <time> from prompt hits shows no notable day-to-day change in the peak position itself to within ±0.01 time bins.
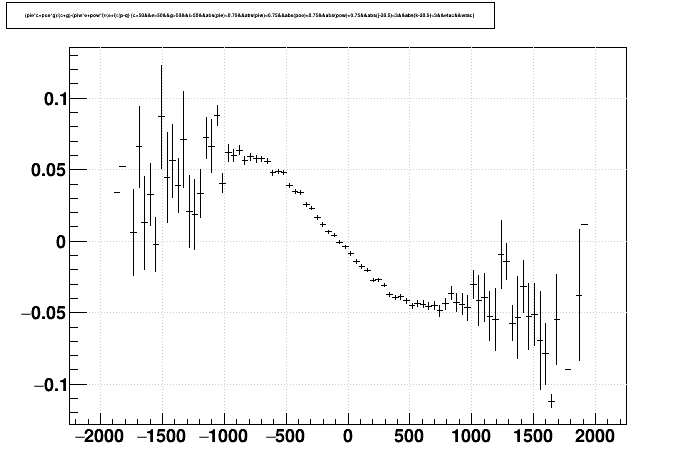
I additionally saved for each event in my ntuple the maximum TACs from the east and west EPD separately (NB: I understand from Irakli that the TAC is the event time reversed: larger numbers means earlier events, which is important to understand when seeing the plots below). This allowed me to see some additional correlations, starting with the difference of the east and west measures of <time> from the prompt hits vs. the difference of the east and west measures of time from the EPD. These both should be representative of the z position of the collision vertex along the z axis, with some non-linearities near the ends where the relative geometries of the TPC prompt hit detection and the EPD detector become important. (NB: I am not proposing to do anything based on this plot; it is merely informative.)
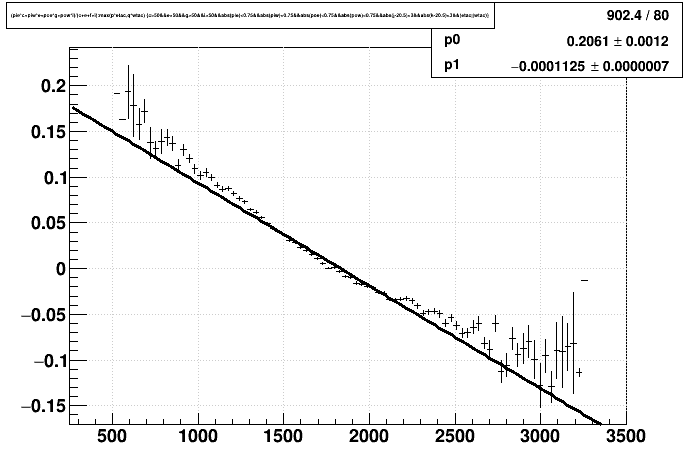
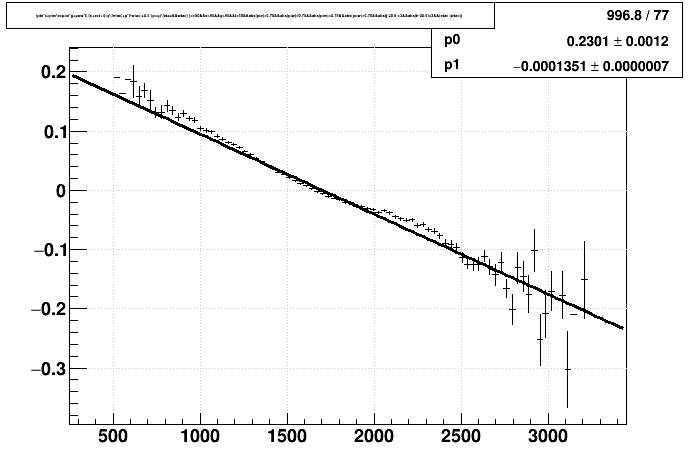
Here is the orthogonal measurement of <time> from the prompt hits of all 4 regions vs. average time from the EPD max TACs, along with a linear fit:

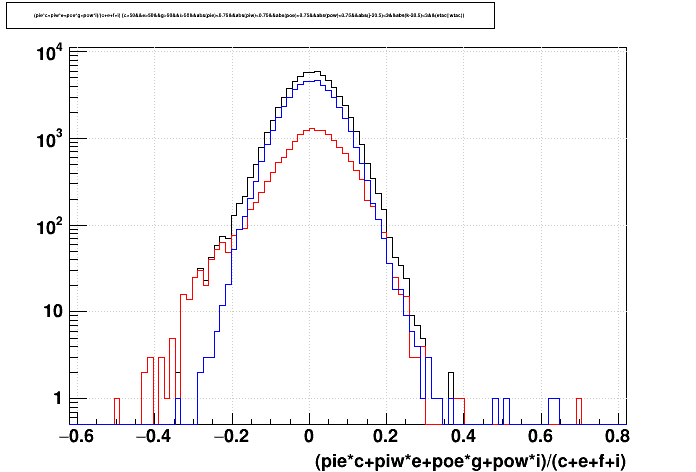
Note that the above requires that there are time measures in both EPD halves. If one were to use the EPD to correct the T0 of the TPC based on the above plot, it would suffer some efficiency loss from that requirement (only 73% of events passed this criteria after passing all my other cuts; 67% before my other cuts). Another option would be to use the max TAC from either EPD half as was done for the FXT TPC T0 correction. This adds statistics (97% of events pass this criteria after my other cuts; 96% before my other cuts), particularly in the tails of the prompt hit distribution as can be seen from this plot of the prompt hit distribution for events where there is an east AND west TAC (blue), and east OR west TAC (black), with the gains from east XOR west TAC (red):
Here then is what we see from using the single max TAC from either side requiring only one EPD side or the other TAC.
A concern I have from this approach is that the vertex position contributes to any single max TAC, which we don't really want. When one side of the EPD has no TACs, the max TAC from the other side is the best we can do for the collision time. However, when both sides have a TAC, then it's a better choice to use the average of the two sides' max TACs as a measure of the collision time. This may be written as:
Below is a plot where I use this hybrid "average-if-possible" approach, demonstrating a reach to earlier prompt hit times. My interpretation of this is that the single max TAC method (shown above) slides some events over to the right on the horizontal axis from where they would be if they were averaged, diluting the early <time> prompt hits at the far right region on the horizontal axis with not-so-early <time> prompt hits and it becomes difficult to see the contribution of the early <time> prompt hits. The hybrid approach provides a way to correct these really early events.
My proposal based on these observations would be to use this hybrid approach to determining the collision time from EPD when correcting the TPC T0. This approach retains the high efficiency of being able to correct events even when only one EPD side has a TAC (~97% as opposed to ~70% when requiring both), yet delivers better accuracy for very early events than using only a single max TAC. It does appear that there may be systematics at the level of ±0.02 time bins (regardless of which approach is used) that will remain after using a simple linear timing correction, but this is an order of magnitude better than the ±0.2 time bin spread that is present in the reconstruction currently.
-Gene
One necessary adjustment was that sectors 4, 10, and 24 seemed to be offset by 1 time bin and I subtracted 1.0 from their hits' time bin positions.
I made some additional cuts to exclude hits:
- Due to recent findings about biases in the position of merged clusters, I selected only hits with flag==0 (not merged).
- Dead regions on either half of the TPC could cause east vs. west asymmetries, so I excluded matching regions from the opposite half:
+ Dead sector:rows :: 4:11-24, 5:57-72, 10:21-40
+ Matching excluded regions :: 20:11-24, 19:57-72, 14:21-40
I then tried to introduce a time-of-flight correction for each of the 4 regions. The factors for east and west seemed close enough to use the same factor on both sides, but different factors for inner vs. outer. And then I applied an additional offset to put all 4 regions centered at 0 where their statistics were good (I wasn't careful to put the prompt hit peak or mean position at zero when I recorded the ntuple, and it was better to wait until this stage to determine the 0 after other cuts anyhow). This worked well except the inner west region, which seemed to show a region of very significant non-linearity at low <padrow> values. I did not come to an understanding of this effect, but it would be worth understanding at some point (side note: I observed the feature persisted for all days in my study). To avoid issues from this in my studies, I cut on <padrow> in the range [17.5,23.5] for the inner data where the linearity was good on both sides, thus excluding some events from my analysis. I also used cuts that each event in my analysis had >50 prompt hits in any region whose <time> was used in the plot, and |<time>| < 0.75 time bins.
With these corrections in place, here are the distributions of inner <time> vs. outer <time> for the east, the west, and then both halves combined. The correlation is evident in all three, showing that there is some common dependence in the form of a varying overall global event T0. (NB: This particular group of plots does not have the cuts on <padrow> not <time>, and the cut on the number of prompt hits was reduced to >0.)
There is some evidence in the above plots (and the one to follow) of prompt hits that are from the previous and next collisions ±1 time bin away, diluted by a few prompt hits from the triggered event so that their peaks are a bit less than 1 full time bin away (and even a hint of the diluted +2 time bin). I should note that these hits from other bunch crossings are largely excluded from my study by cuts I had in selecting on the region of hits that I called "prompt" to a window of ~3 time bins total in the first place.
Below on the left is what I get for the distribution if I use all 4 regions to define a single <time> for each event (weighted by the number of hits for each region). On the right is that distribution plotted vs. day number of the runs I examined, where we can see that runs in the early days seemed to have more in the previous/next collision peaks, and also that run 20087007 (day 87) had a much more smeared <time> distribution (I checked in all 4 TPC regions), which I suspect is due to lots of beam ions slipping out of the desired RF buckets near the end of a fill if I understand the relevant ShiftLog entry properly. Otherwise, the <time> from prompt hits shows no notable day-to-day change in the peak position itself to within ±0.01 time bins.
I additionally saved for each event in my ntuple the maximum TACs from the east and west EPD separately (NB: I understand from Irakli that the TAC is the event time reversed: larger numbers means earlier events, which is important to understand when seeing the plots below). This allowed me to see some additional correlations, starting with the difference of the east and west measures of <time> from the prompt hits vs. the difference of the east and west measures of time from the EPD. These both should be representative of the z position of the collision vertex along the z axis, with some non-linearities near the ends where the relative geometries of the TPC prompt hit detection and the EPD detector become important. (NB: I am not proposing to do anything based on this plot; it is merely informative.)
Here is the orthogonal measurement of <time> from the prompt hits of all 4 regions vs. average time from the EPD max TACs, along with a linear fit:
Note that the above requires that there are time measures in both EPD halves. If one were to use the EPD to correct the T0 of the TPC based on the above plot, it would suffer some efficiency loss from that requirement (only 73% of events passed this criteria after passing all my other cuts; 67% before my other cuts). Another option would be to use the max TAC from either EPD half as was done for the FXT TPC T0 correction. This adds statistics (97% of events pass this criteria after my other cuts; 96% before my other cuts), particularly in the tails of the prompt hit distribution as can be seen from this plot of the prompt hit distribution for events where there is an east AND west TAC (blue), and east OR west TAC (black), with the gains from east XOR west TAC (red):
Here then is what we see from using the single max TAC from either side requiring only one EPD side or the other TAC.
A concern I have from this approach is that the vertex position contributes to any single max TAC, which we don't really want. When one side of the EPD has no TACs, the max TAC from the other side is the best we can do for the collision time. However, when both sides have a TAC, then it's a better choice to use the average of the two sides' max TACs as a measure of the collision time. This may be written as:
| EPD time = | ( no west TACs | : east max TAC |
| ( no east TACs | : west max TAC | |
| ( both side TACs | : 0.5*(east+west) max TACs | |
| ( no TACs | : mid point of the EPD time distrbution |
Below is a plot where I use this hybrid "average-if-possible" approach, demonstrating a reach to earlier prompt hit times. My interpretation of this is that the single max TAC method (shown above) slides some events over to the right on the horizontal axis from where they would be if they were averaged, diluting the early <time> prompt hits at the far right region on the horizontal axis with not-so-early <time> prompt hits and it becomes difficult to see the contribution of the early <time> prompt hits. The hybrid approach provides a way to correct these really early events.
My proposal based on these observations would be to use this hybrid approach to determining the collision time from EPD when correcting the TPC T0. This approach retains the high efficiency of being able to correct events even when only one EPD side has a TAC (~97% as opposed to ~70% when requiring both), yet delivers better accuracy for very early events than using only a single max TAC. It does appear that there may be systematics at the level of ±0.02 time bins (regardless of which approach is used) that will remain after using a simple linear timing correction, but this is an order of magnitude better than the ±0.2 time bin spread that is present in the reconstruction currently.
-Gene
»
- genevb's blog
- Login or register to post comments