Beam Studies at 500 GeV
Several measurements were taken of the beam position and beam polarization over many fills during the 2009 RHIC 500 GeV running period. Several studies were made from these measurements and are given in several sections below.
I. Beam Position Measurements
There has been an observed dependence of the physics asymmetry with “radius” in the ZDCs used as a beam polarimeter. One possibility for this dependence could be the effect of beam position on the ZDCs. We received some data on measured beam positions near STAR as a function of time (fill) from Todd Satogata (C-AD). The horizontal and vertical positions of the beam are measured at a position, called the 6 o’clock position, 8 m to the west of STAR and also at the 5 o’clock position, 8 m to the east of STAR. These measurements were taken during the 500 GeV run between March 7, 2009 and April 13, 2009. The horizontal and vertical beam positions (in μm) are plotted together for both the yellow and blue beams, with each point representing a measurement at a point in time. These plots are shown below:
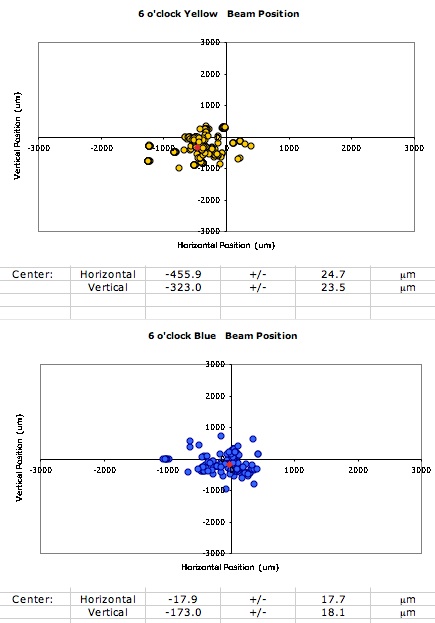
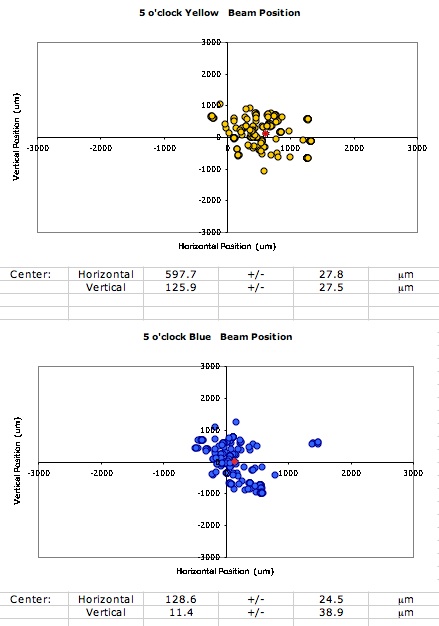
Fig. 1. Plots of yellow and blue beam positions measured 8 m upstream and downstream of STAR corresponding to about one month of running time at 500 GeV.
The red dot indicates a straight average of the beam location over all of the measurements, and the values are given below the picture. The coordinate system in each plot is determined by the C-AD device reading the position. The standard deviations of the beam positions over this period are: yellow horizontal (5 o’clock) is 0.43 mm, yellow vertical (5 o’clock) is 0.42 mm, yellow horizontal (6 o’clock) is 0.38 mm, yellow vertical (6 o’clock) is 0.36 mm, blue horizontal (5 o’clock) is 0.37 mm, blue vertical (5 o’clock) is 0.59 mm, blue horizontal (6 o’clock) is 0.27 mm, and blue vertical (6 o’clock) is 0.27 mm.
The corresponding beam positions as a function of time are shown in the following plots:
.jpg)
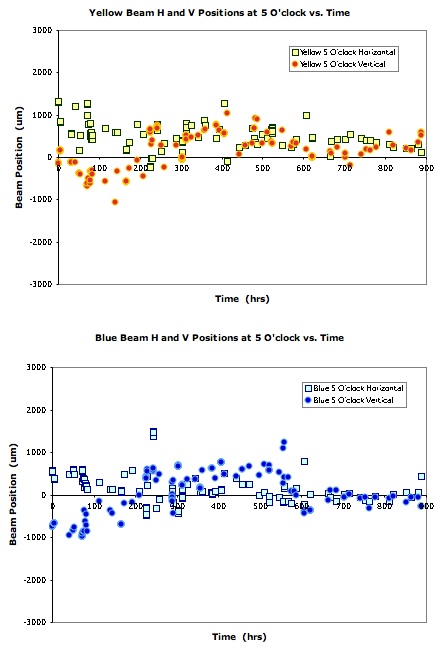
Fig. 2. Plots of yellow and blue beam horizontal and vertical positions measured 8 m west (6 o’clock) and east (5 o’clock) of STAR corresponding to about one month of running time at 500 GeV. Time t=0 in the plots starts arbitrarily on March 7, 2009 at 12:01 EST.
Note that the transverse spin runs at 500 GeV were taken until approximately 225 hours on the scale given above.
Using the horizontal and vertical points at 5 and 6 o’clock, an extrapolation can be made of the beam position at the locations of the ZDCs (18 m) and at the “collision point” (0 m), assuming that the beam trajectories were straight lines. These extrapolated beam positions are shown for the ZDCs below, using the same scale as the plots above. Also, the red dots and the mean positions of the beams are defined in the same manner as above.
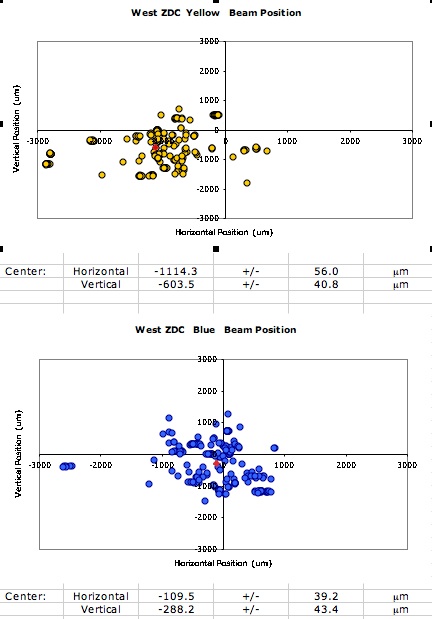
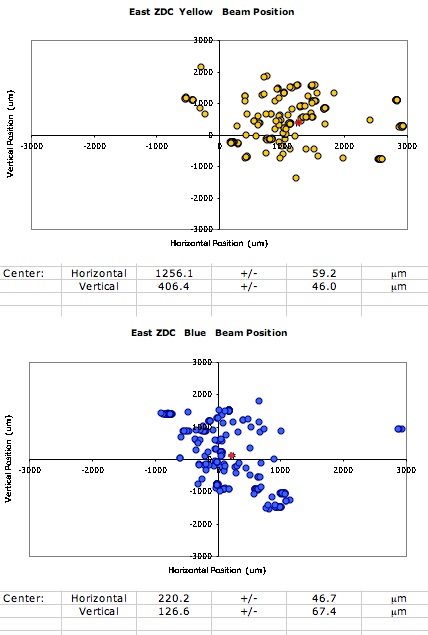
Fig. 3. Plots of yellow and blue beam positions extrapolated to 18 m upstream and downstream of STAR at the locations of the ZDCs.
Most of the beam positions during this time period fall within about 0.5 mm (standard deviation) of each other. There are a few data points at the extreme edges of the plot, corresponding to about 3 mm from the center of the coordinate system. Note that the distance between centers of each SMD strip is 5 mm, so the effect of a typical shift in the beam position will be very small at the ZDCs. Large beam excursions of several millimeters would be more likely to be detectable in the ZDC SMD scintillator strips. However, asymmetries in the ZDCs are calculated using slats, consisting of either 3 or 4 scintillator strips, so changes in beam position would probably not be observed with the slats.
A last plot shows the extrapolation of the beam position at the collision point, as shown below. These positions were again calculated from the beam-position measurements taken at 8 m upstream and downstream of STAR, as described previously. The left set of plots corresponds to the calculated beam position as a function of time, again starting with the arbitrary time point on March 7, 2009. The right plots show the extrapolated beam positions at z = 0 m. Note that both yellow and blue beams shifted position in the vertical direction by about 0.5 mm, approximately after the 500-GeV transverse spin runs or around 225 hours.
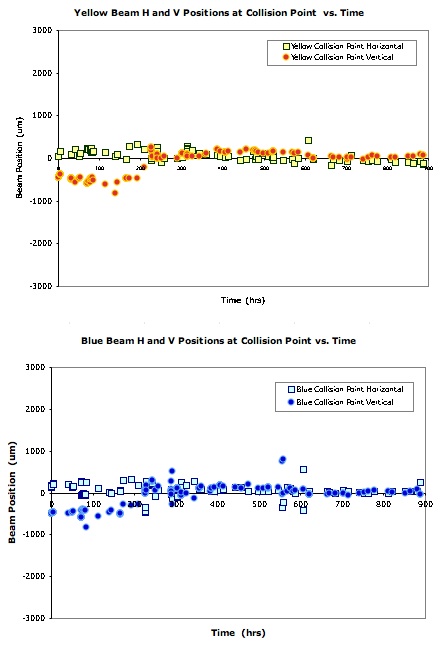
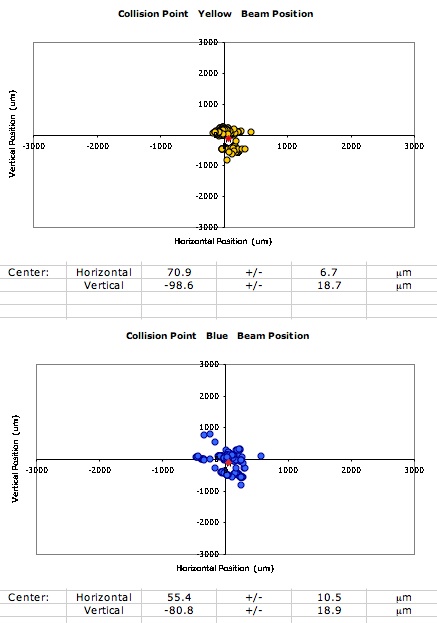
Fig. 4. (Left) Plots of yellow and blue beam horizontal and vertical positions extrapolated to the collision point (z = 0) as a function of running time. (Right) Yellow and blue beam positions extrapolated to the collision point from beam measurements taken 8 m upstream and downstream from STAR.
II. Polarization Measurements
Using the CDEV database that lists the CNI polarization measurements, data were analyzed for fills 10357- 10399, which were taken during the 500-GeV run period. The new starting time (t = 0) corresponds to 7:17 AM on March 13, 2009 and continues until approximately 175 hours later on March 20, 2009. This time period overlaps with the analysis performed in obtaining the asymmetries and analyzing powers using transversely-polarized protons with the ZDC. In addition, there is some overlap of this data with the beam position measurements, and that will be discussed in the next section.
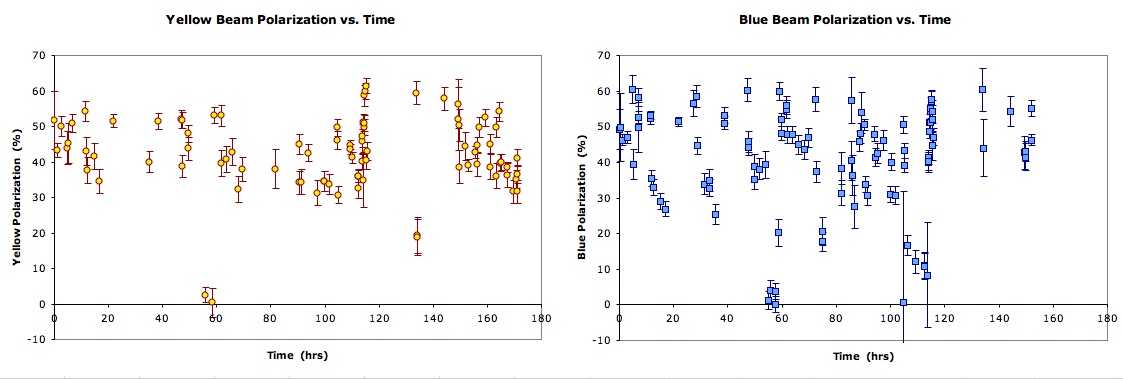
Fig. 5. Plots of yellow and blue beam polarization measurements from the CNI polarimeter as a function of time (in hours), starting with t = 0 at 7:17 on March 13, 2009.
The measured values of the beam polarization for the yellow and blue beams are shown in the plots displayed above. From these plots, it can be seen that each fill has its own unique CNI polarization measurement(s). A straight average over the time period indicates that the yellow beam had a value of 42% and the blue beam a value of 41%, with standard deviations of 11% and 15%, respectively. Several polarization measurements have a near-zero value at approximately t = 60 hrs, corresponding to fill 10372.
The polarization data may be replotted to show the beam polarization values at injection into RHIC at 25 GeV, and later with the polarization measurements at 250 GeV. These are shown on the expanded time scale from 0 to 60 hours in the plots below:
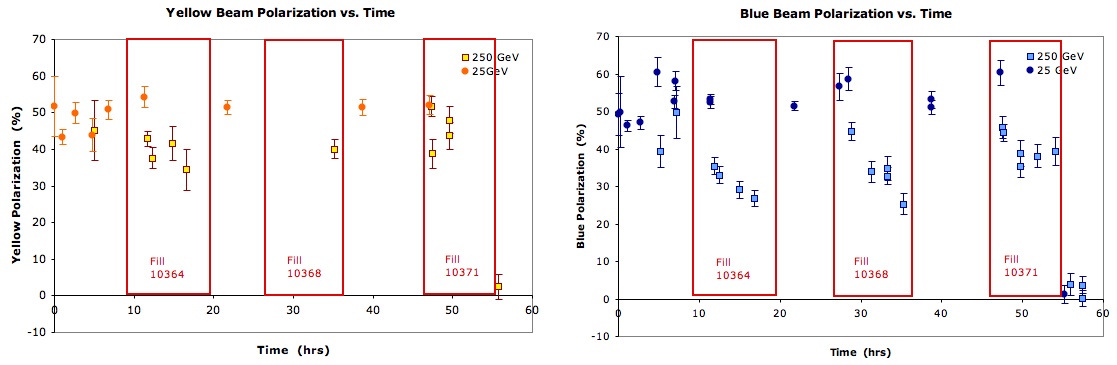
Fig. 6. Expanded yellow and blue beam polarization measurements from the CNI polarimeter as a function of time (in hours), where the values at injection and after acceleration are shown. The red boxes indicate the time periods for fills 10364, 10368, and 10371.
The CNI beam polarization measurements for both yellow and blue beams are shown within the red boxes for the three fills, 10364, 10368, and 10371. It can be seen from Fig. 6 that the beam polarization value decreases during the lifetime of a fill. It should also be noted that the polarization value assigned to a given fill is listed in the database as a straight, not weighted, average of the CNI polarization measurements over that fill. A similar effect can be seen on the measured CNI polarization values at the later times shown in Fig. 5 above.
It can also be observed that the number of polarization measurements can be quite different for the yellow and blue beams during a given fill. Within fill 10368 (about 8 hours long), there was only one measurement at 250 GeV for the yellow beam, while there were 2 polarization measurements at injection and 4 measurements at 250 GeV.
ZDC data were also analyzed from data runs taken during these three fills. It is expected that the calculated asymmetries should reflect a similar decrease during the fill. Currently, the data runs do not show this change within statistics. This, however, could be due to statistical variations in the number of hits within the run and the effect would be hidden.
III. Correlations Between Beam Position and Polarization
Another study combined the beam-position data with the polarization measurements and looked for possible correlations between the two quantities. To do this, the CNI polarization measurements from the CDEV database were matched as closely as possible in time to the beam position measurements. Typically, these two separate measurements were made within an hour of each other. The CNI polarization measurements for the yellow and blue beams over the same time period as in Figs. 1 and 2 are shown below:
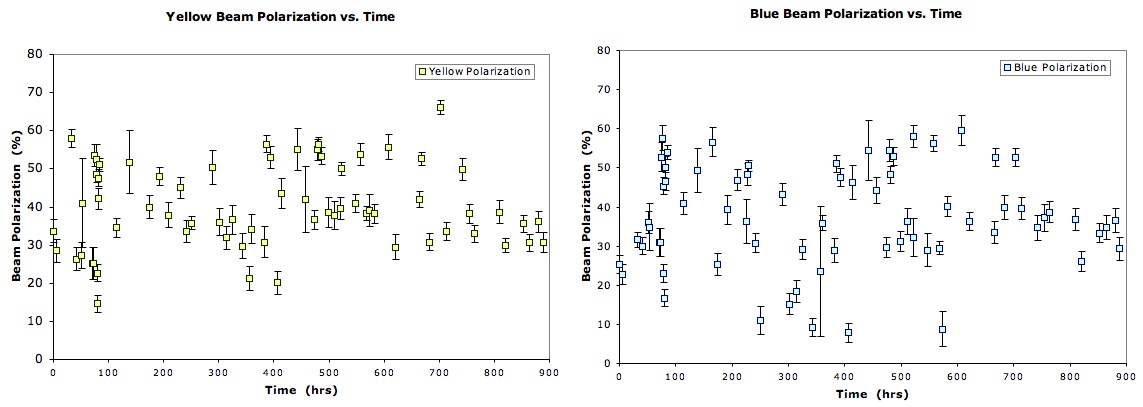
Fig. 7. Plots of yellow and blue CNI beam polarization measurements as a function of time. The polarization measurements are matched to the same time period shown in Figs. 1 and 2 above.
A correlation of the yellow and blue CNI polarization measurements with each other is displayed below:
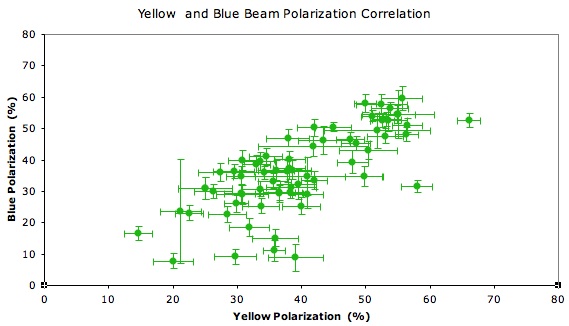
Fig. 8. Correlation between CNI beam polarization values for yellow and blue beams over the time period shown in Fig. 7.
The correlation observed in Fig. 8 in general shows a reasonable agreement between the two beam polarization measurements.
The correlation plots between beam position and polarization are shown below for the extrapolated points at the ZDC and also at the collision point for both yellow and blue beams, and in both horizontal and vertical directions. As before, the extrapolated positions are obtained from beam position measurements at 8 m upstream and downstream of STAR.
Yellow Beam, West ZDC Blue Beam, West ZDC
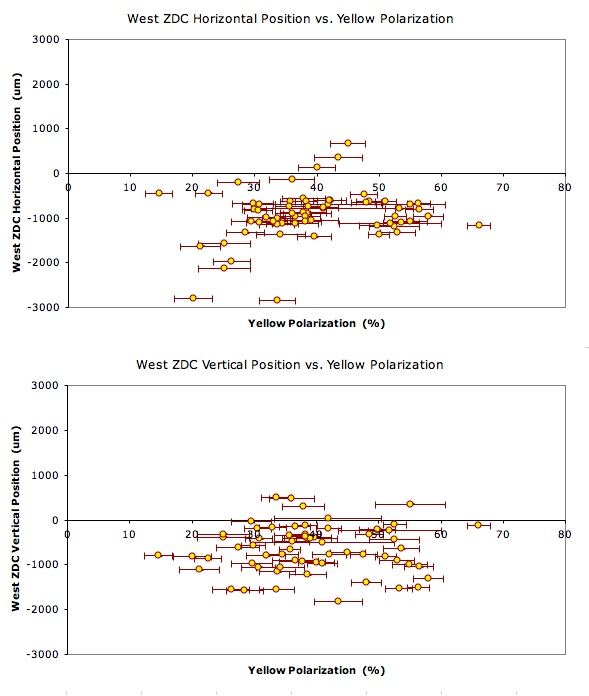
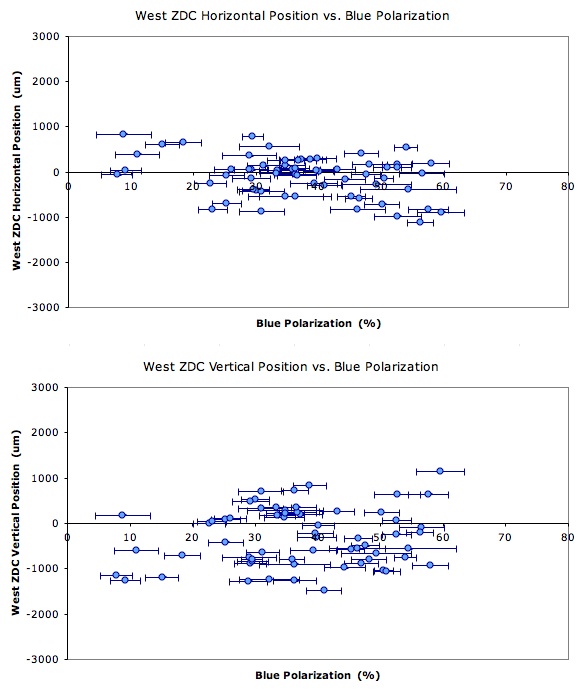
Yellow Beam, East ZDC Blue Beam, East ZDC
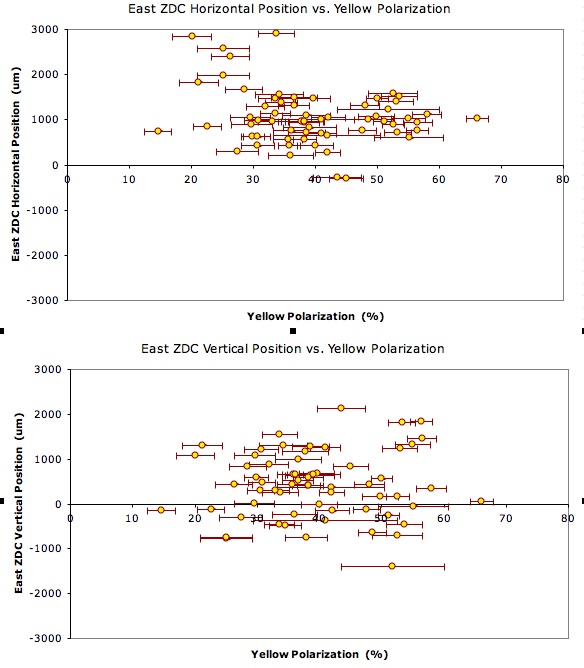
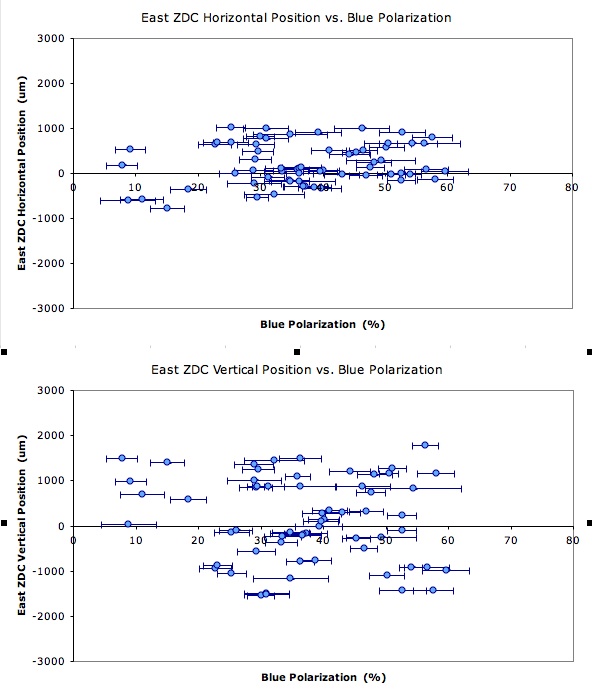
Yellow Beam, Collision Point Blue Beam, Collision Point
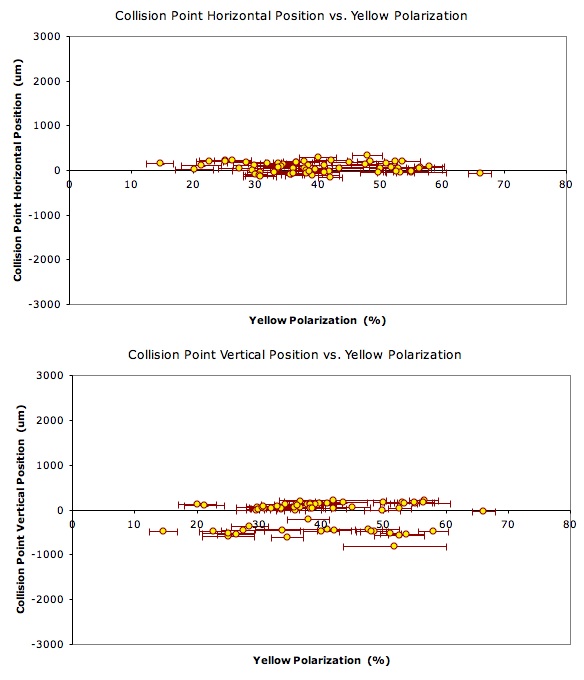
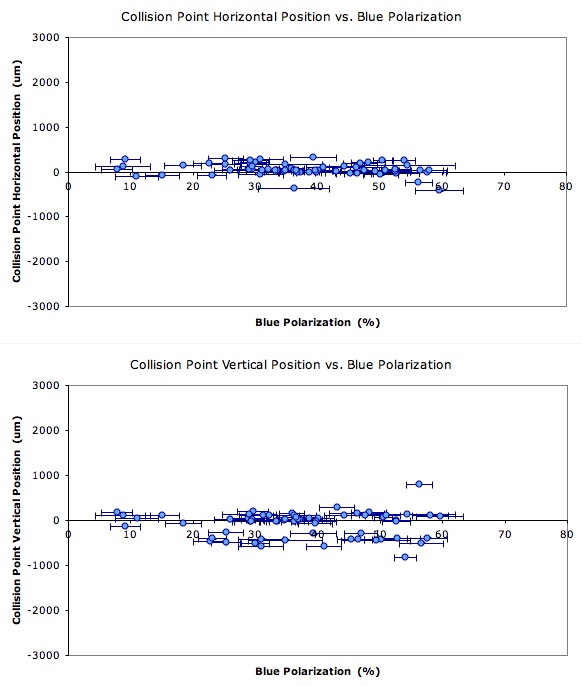
Fig. 9. Correlation plots of beam position and CNI beam polarization values for yellow and blue beams in the horizontal and vertical positions calculated for the east and west ZDCs and for the collision point.
From the plots shown above, there does not appear to be any large observable correlation between beam positions and beam polarizations.
IV. Conclusions
In the first study, the beam positions were measured 8 m upstream and downstream of STAR. These are shown, together with the values in time, for a time period of over a month. Using these measurements, the beam positions can be extrapolated to the locations of the ZDCs and also to the collision point. The beam positions are observed to vary mostly by about 0.5 mm, with some occasional large excursions up to 3 mm. Beam position changes will be difficult to observe in the ZDC SMD slats and scintillator strips.
The second study looked at the beam polarization as a function of time. A decrease in the CNI beam polarization measurement during a fill was observed. The beam polarization assigned to a fill is the straight average of all of these CNI polarization measurements. Further study is underway to observe corresponding changes in the asymmetries measured by the ZDCs and to characterize the decrease in polarization.
Correlation plots were made of the extrapolated beam positions in the horizontal and vertical and the beam polarizations of the yellow and blue beams at the locations of the ZDCs and the collision point. No significant correlation was observed between these two quantities.
- grosnick's blog
- Login or register to post comments