Update on Calibration Analysis for Run 9 - EEMC Towers
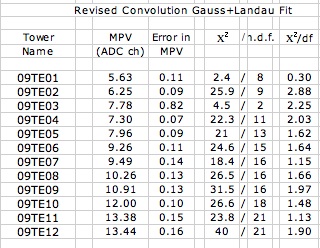
As mentioned in the previous blog entry, changes were made to the method that fit a convolution of Gaussian and Landau functions to the EEMC tower ADC spectra, so that the fit ranges and the maximum and minimum values of the parameters were improved (see 21 July 2010 update in aliceb blog). A new table of the MPV, chi-squared, and chi-squared per degree of freedom was made for towers in sector 9, sub-sector E, and eta bins 1-12:
A new comparison of the three methods (described in the previous blog entry) for the same sector and sub-sector can then be made. The MPV values are now given by the following graph:
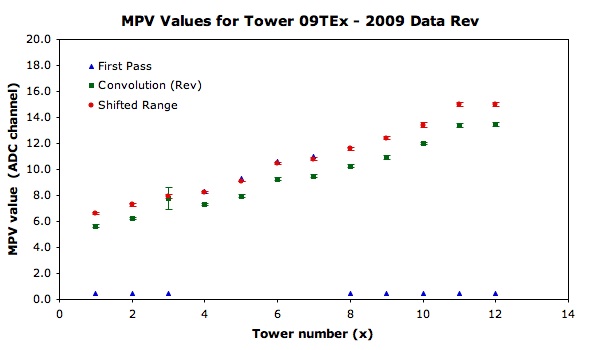
The revised convolution method and the shifted-range method now track each other more closely, but are shifted by about 1-2 ADC channels. This systematic diffeence may be due to the selection of the fit range to include more or less of the Landau tail.
The second comparison given in the previous blog entry was made with a plot of the chi-squared per degree of freedom for the same towers using the convolution and shifted-range methods. A new plot was made using data from the revised convolution method, and is shown below:
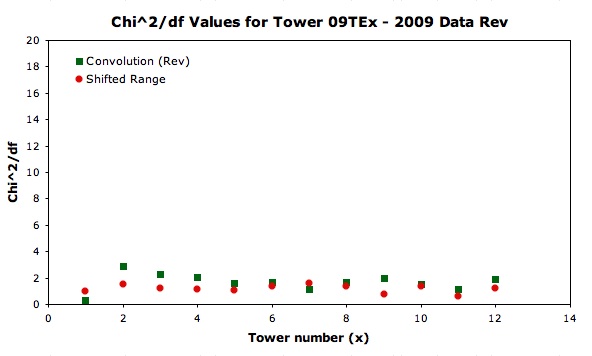
This plot shows that the large values of the chi-squared per degree of freedom in the ADC fits of several towers using the convolution method have disappeared with the revised data. The two methods now have similar fits to the ADC spectra that are more closely aligned with one another.
The use of either of these methods in the analysis will also depend on ease of implementation and computer time needed to run the code in the analysis.
A Brief Comparison of EEMC Tower Calibration Data from 2006 and First Pass 2009
A comparison of EEMC tower calibration data from the final gains table from the 2006 calibration was made with the tower data taken from the first pass of the 2009 data. Even though EEMC calibration data for 2009 are still preliminary, it may be useful to compare data distributions that have been produced in progress with those made in a past calibration.
The 2006 data were taken from the EEMC tower gains table found in: http://web.mit.edu/rhic-spin/public/eemc-bnl/calibration/run2006/cal2006/. The distributions of EEMC tower gains, MPVs, and pedestal means were assembled for 716 tower channels and plotted in the figures below for both 2006 and 2009 calibration data.
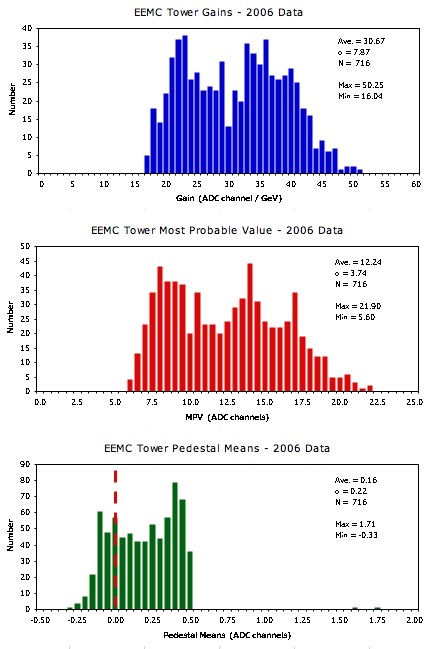
Fig. 1. Histograms of the EEMC tower gains, MPVs, and pedestal means from the 2006 final calibration data.
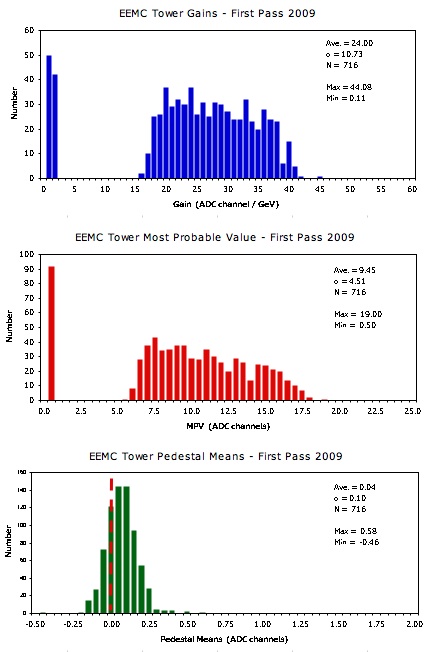
Fig. 2. Histograms of the EEMC tower gains, MPVs, and pedestal means from the preliminary, first-pass 2009 calibration data.
In Fig. 2, there are significant numbers of towers with very low gains and low MPV values. These groups may be explained by a problem discovered in the peak-fitting routines, in which the fit includes a portion of the pedestal within the fit region. This problem leads to small gain and MPV values. It can also be noted that the distributions of gains and MPVs, excluding the low values, appear to have a smaller spread for the 2009 calibration than in 2006.
A comparison of the distributions of pedestal means from the two calibrations shows some interesting differences. The 2009 data indicate a more Gaussian distribution, which is slightly offset from zero. The 2006 data show a much wider distribution of pedestal means and include two channels that are far from the mean of the distribution. It should be noted that both distributions are within one ADC channel.
Further analysis with the 2009 data should fix the problems with the low ADC channels and find a convergence for values of the EEMC tower gains.
- grosnick's blog
- Login or register to post comments