Toy MC for EPD dN/deta
In the current EPD software framework, pseudorapidity (=eta) is determined based on the primary vertex position and the particle position at EPD. In particular, the particle position at EPD is assigned with StEPD::RandomPointOnTile(Int_t UniqueID), which assumes a uniform distribution of particles within each tile. Depending on the true eta distribution, tile location, and eta bin size, the effect of this assumption comes out differently. This page shows the effect of StEPD::RandomPointOnTile(Int_t UniqueID) in eta estimation, and suggests new methods with toy Monte Carlo simulations. Corresponding toy MC codes are attached at the bottom of this page, MCdndeta.tgz.
Toy MC simulations
- True dN/deta as an input of the simulation is taken by fitting the measured dN/deta with a Gaussian function.
.png)
which is used as an input of the simulation (=True dN/deta).
- When the primary vertex position, (x_vtx, y_vtx, z_vtx), is (0, 0, 0), the eta range of EPD is [-5.09, -2.14]. Also, (x_vtx, y_vtx, z_vtx) = (0, 0, -30) corresponds to the eta range [-5.01, -2.06], and (x_vtx, y_vtx, z_vtx) = (0, 0, 30) corresponds to the eta range [-5.17, -2.21]. This explains the sudden drop in the right most bin of the measured dN/deta (black line), as z_vtx cut for the measurement is [-30, 30]. Coefficients of Gaussian function is estimated in the range of [-5.2, -2.14] in eta, but the true dN/deta (red line) has the range of [-5.2, -2.0].
- 10M separated hits at [-5.2, -2.0] range are generated, following the input dN/deta distribution. In real measurements, multi-hits in a single tile should be dealt more carefully.
Uniform distribution in each tile
- As documented in EPD User Guide and Reference Manual (https://drupal.star.bnl.gov/STAR/system/files/StEpd.pdf, Appendix A), the radius distribution within each tile under the assumption of a uniform distribution follows
- In the simulation, particle's radius from the beam axis (=r, equal to y in the above equation) is determined in the same way as StEPD::RandomPointOnTile(Int_t UniqueID).
- With the primary vertex position fixed to (0, 0, 0), true dN/deta is converted into true dN/dr. This dN/dr is shown in the following figure in along with the (simulated) measured dN/dr under the assumption of a uniform distribution of particles in each tile.
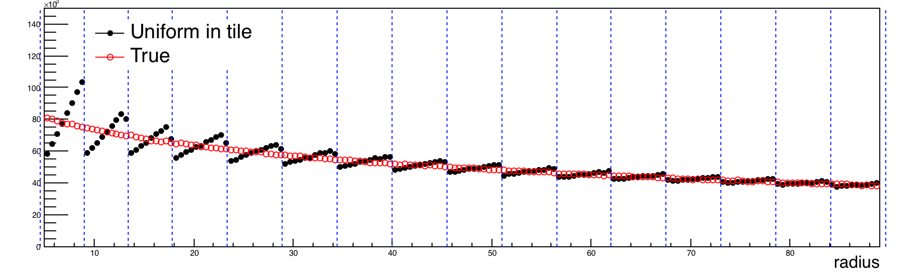
distribution in each tile. (x_vtx, y_vtx, z_vtx) is fixed to (0, 0, 0).
- Blues lines on figures represent different tiles in EPD. EPD tiles are trapezoids, and a uniform distribution of particles within each tile results in the increasing distribution of particles as a function of radius within each tile.
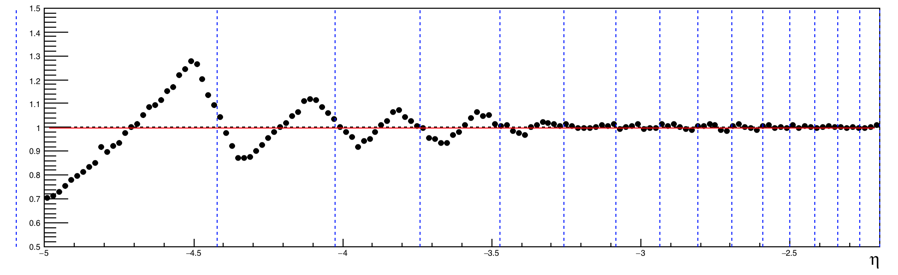
- True dN/deta and (simulated) measured dN/deta are also compared.

distribution in each tile. (x_vtx, y_vtx, z_vtx) is fixed to (0, 0, 0).

(x_vtx, y_vtx, z_vtx) is fixed to (0, 0, 0). Mean value (red) is 0.9919 +- 0.0005.
- Only ratio of these two (=(measured dN/deta)/(True dN/deta)) will be shown in the following discussions.
- When the width of x-axis bin becomes large, the increasing ratio within each tile becomes less visible especially at eta near -2.2.

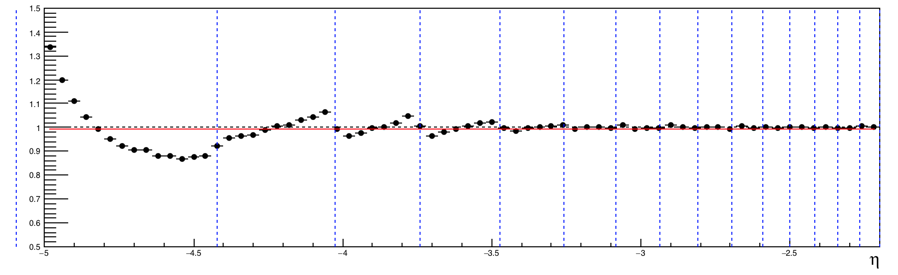
(Measured dN/deta)/(True dN/deta) assuming a uniform distribution in each tile
with larger bin width. (x_vtx, y_vtx, z_vtx) is fixed to (0, 0, 0).
- Instead of using fixed vertex position at (0, 0, 0), z_vtx is assumed to be uniformly distributed within [-30, 30].
(Measured dN/deta)/(True dN/deta) assuming a uniform distribution in each tile.
z_vtx is uniformly distributed within [-30, 30], while x_vtx and y_vtx are fixed
to 0. Mean value (red) is 0.9978 +- 0.0005.
- Non-fixed z_vtx distribution smears the measured dN/deta distribution. In real measurements, x_vtx and y_vtx also contribute to the smearing, and the effect of the assumption of uniformity may get reduced.
Assigning eta based on a known function
- Instead of using StEPD::RandomPointOnTile(Int_t UniqueID), which assumes a linear dN/dr in each tile, different shape functions can be used to assign eta value of tracks. One idea is to use the measured dN/deta (or dN/dr) as a shape function to fill out dN/deta in each tile, and repeat the process iteratively.
- As an example, measured dN/dr from the simulation with StEPD::RandomPointOnTile(Int_t UniqueID) is fitted with a exponential function, A*Exp(B(r-C)), over the all eta range, and new eta is assigned based on this function from each tile.
.png)
(Measured dN/deta)/(True dN/deta) based on the exponential function fitted with the previously measured dN/dr.
(x_vtx, y_vtx, z_vtx) is fixed to (0, 0, 0). Mean value (red) is 1.0001 +- 0.0005.
Using RooUnfold
- When we have both true distribution and measured distribution, we can utilize unfolding techniques via RooUnfold package.
- With the above input function (Gaussian), StEPD::RandomPointOnTile(Int_t UniqueID) for eta determination, and fixed (x_vtx, y_vtx, z_vtx) to (0, 0, 0), the response matrix is generated.
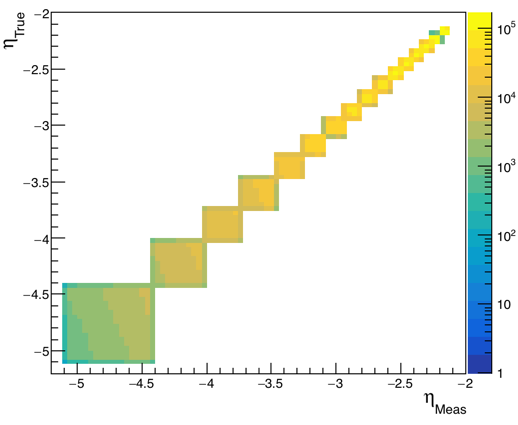
Response matrix for unfolding when eta is assigned with StEPD::RandomPointOnTile(Int_t UniqueID)
and (x_vtx, y_vtx, z_vtx) is fixed to (0, 0, 0).
- To test this response matrix, a different input function is needed. (If the same input function is used, unfolding result is equal to the input function.) Measured RefMultBin0 dN/deta is fitted with a third-order polynomial, and this polynomial is used as a new input function.
- With Bayesian method for unfolding, various numbers of iteration are tested.
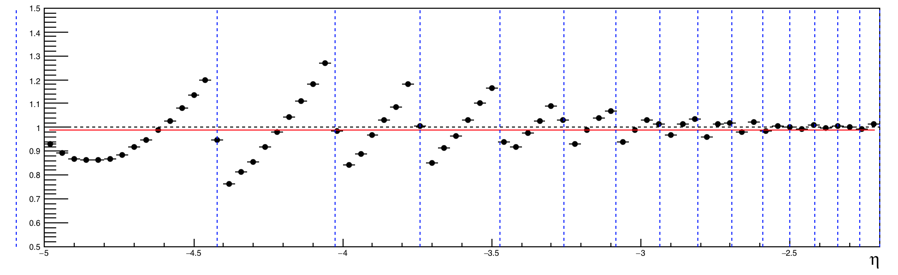
(Measured dN/deta)/(True dN/deta) with a 3rd-order polynomial true dN/deta assuming a
uniform distribution in each tile. (x_vtx, y_vtx, z_vtx) is fixed to (0, 0, 0).

(Unfolded dN/deta)/(True dN/deta) after 1 iteration of Bayesian unfolding.
(Unfolded dN/deta)/(True dN/deta) after 4 iteration of Bayesian unfolding.
- For real measurements, the response matrix should be generated with MC simulations including detector response via GEANT3.
Summary
- Current eta is assigned with StEPD::RandomPointOnTile(Int_t UniqueID), which assumes a uniform distribution of particles in each tile.
- Non-fixed vertex distributions and large bin width in eta may make the corresponding effect not significant.
- Instead of StEPD::RandomPointOnTile(Int_t UniqueID), a known function can be used to assign eta in each tile. The output dN/deta can be used as a new input shape, and this process can be repeated, iteratively.
- Unfolding via RooUnfold package can be another method. However, MC simulations with GEANT3 is required for generating a proper response matrix. Both methods (using a known function + unfolding) can be used simultaneously.
- Codes are available in the attachment, MCdndeta.tgz.
- hanseul's blog
- Login or register to post comments