HCalorimeterTest
Penn State students have collected data and have done preliminary analysis including a first look at Cosmic Ray ADC distributions as a function of High Voltage. Data were collected for each of 50 Hadron Calorimeter cells.(Sept 4, 2009)
For each of 50 HCal cells, cosmic ray ADC distributions were obtained at three voltage settings. Voltages were set to RDAC values on the PSU controllers for Yale bases. For most cells, the RDAC values used were hex 70, B0 and D0.
For each ADC distribution we do a gaussian fit to the minimum ionizing particle peak
Finally, for each cell the ADC peak is plotted as a function of RDAC control voltage. PSU students are currently working on checking these results and replotting mean ADC value vs the actual Voltage rather than RDAC value as is presented here.
To see results, right click and download the root file containing the histogram ADC distributions for all cells. All ADC distributions in this root file represent a charge integration, set up with 0.2 pC per ADC count.
http://www.star.bnl.gov/protected/spin/heppelmann/HCal/PSU_Hcal_Data_Aug-09.root
or a pdf with 1 page per cell: http://www.star.bnl.gov/protected/spin/heppelmann/HCal/PSU_Hcal_Data_Aug-09.pdf
To look at the root file, download it, run root on it and then open a TBrowser() in root.
>root PSU_Hcal_DatA_Aug-09.root
root.exe[1] new TBrowser()
root.exe[2]
Within the TBrowser click on ROOT Files and then Click on PSU_Hcal_Data_Aug-09.root
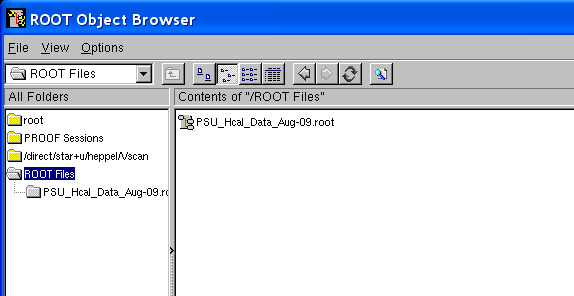
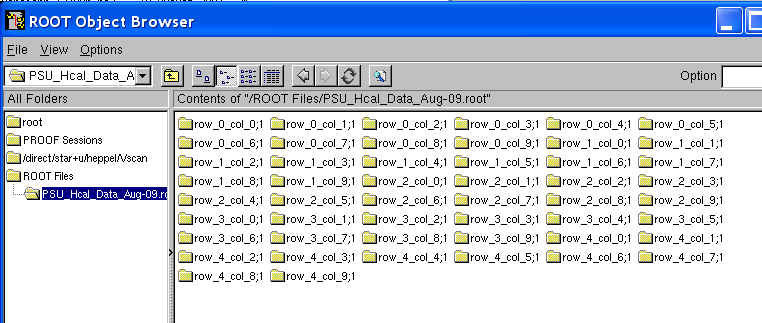
next select one of the 50 folders shown (for one of the 50 HCal cells).
Each folder contains data for a particular row and col.
For a nice summary for the particular cell chosen, click canvas.
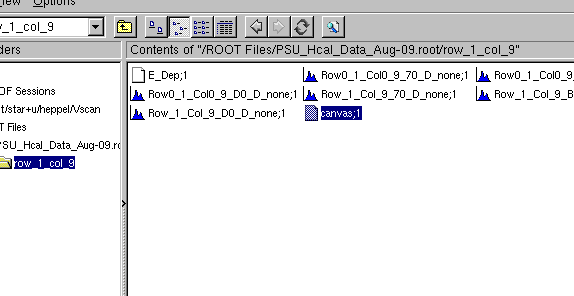
What you then will see are plots showing fits for each of three different voltages.
In the lower right corner of the canvas plot is a graph of mean peak position vs RDAC value.
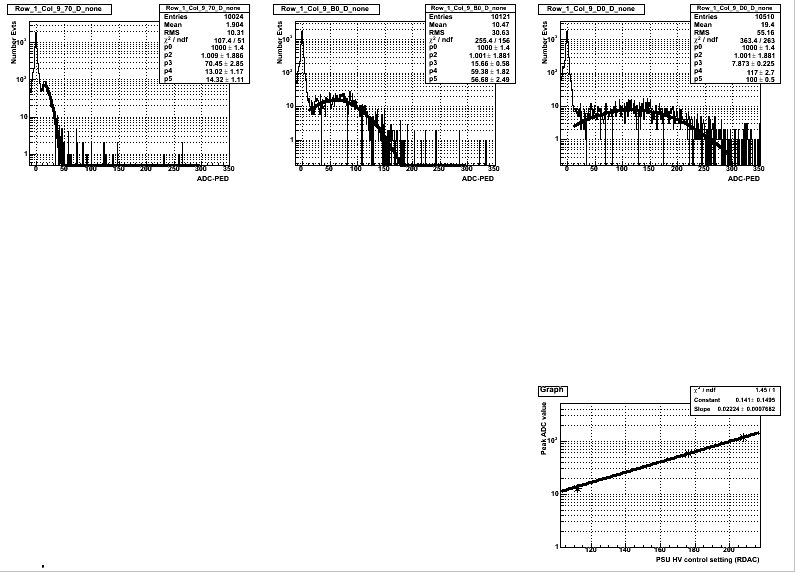
Students who's names are below are currently working to refine these results, and in particular to add actuall voltage to the x axis of the lower right plots.
Testing Hadron Calorimeter Modules (Aug. 17, 2009)
Len Eun,
Douglas Jacoski, Bruce Randall, Toby Veselich, and Steve Heppelmann
Penn State University
The purpose of the testing is to verify the functionality of the phototubes, bases, and lead/optical fiber columns of the 5X10 stack of Hadron calorimeter modules in the assembly area. Cosmic ray muons will be used for the testing. The first stage of testing would involve triggering on a subset of modules for cosmic rays, and verifying that we can identify tracks in the transverse plane going through various parts of the stack. The second stage of testing would add two small scintillators/phototubes to study the longitudinal variations of the response per channel due to attenuation and/or fiber breakage.
The phototube bases for the Hadron calorimeter are of Cockcroft-Walton type. It is almost identical to the ones used in the FMS small cells, and it has been verified that we can use the same FMS HV control electronics to drive them. We have fabricated extra spare control boards for this purpose, and currently we have enough to drive up to 64 channels. The system requires three low voltage supplies (30V, 9V, and -6V), and no external high voltage. The bases also have internal discriminator outputs (NIM) that can be used as triggers.
We have brought from Penn State a VME crate with a 16 channel QDC which will be used as the read-out. It will be run through USB connection by a desktop computer. This will allow us to perform basic tracking studies.
Once we establish the basic functionality of the modules, we will use a pair of small scintillators to measure the longitudinal variation in response within each module. These scintillating pads are attached to phototubes driven by resistive bases. We will use a dual-channel high voltage supply for this purpose.
First Data
This summer, PSU students fabricated a new Master Control High voltage controller and 4 Yale type controllers.
This provides control for up to 64 channels of Yale phototube bases and can thus be plugged indirectly to control high voltage for all 50 channels of the Hadron Calorimeter module that is now located in the STAR assemly area. All high voltages were set so all channels gave reasonable signals.
Approval from BNL safty was obtained by the end of the day on August 6. On Aug 7, we began to make some measurements.
The following figure shows the 50 cell calorimeter, viewed from the connection end.
We have begun by setting up a self trigger using discriminated signals from 8 cells.
The triger condition is (top1+top2+top3+top4)*(bot1+bot2+bot3+bot4).
We are reading out the 12 cells sandwiched between these trigger cells.
This is the configuration

This Trigger appears very clean for single stiff cosmic ray muons.
The Trigger rate is mesured in the range of 10 to 100 hz
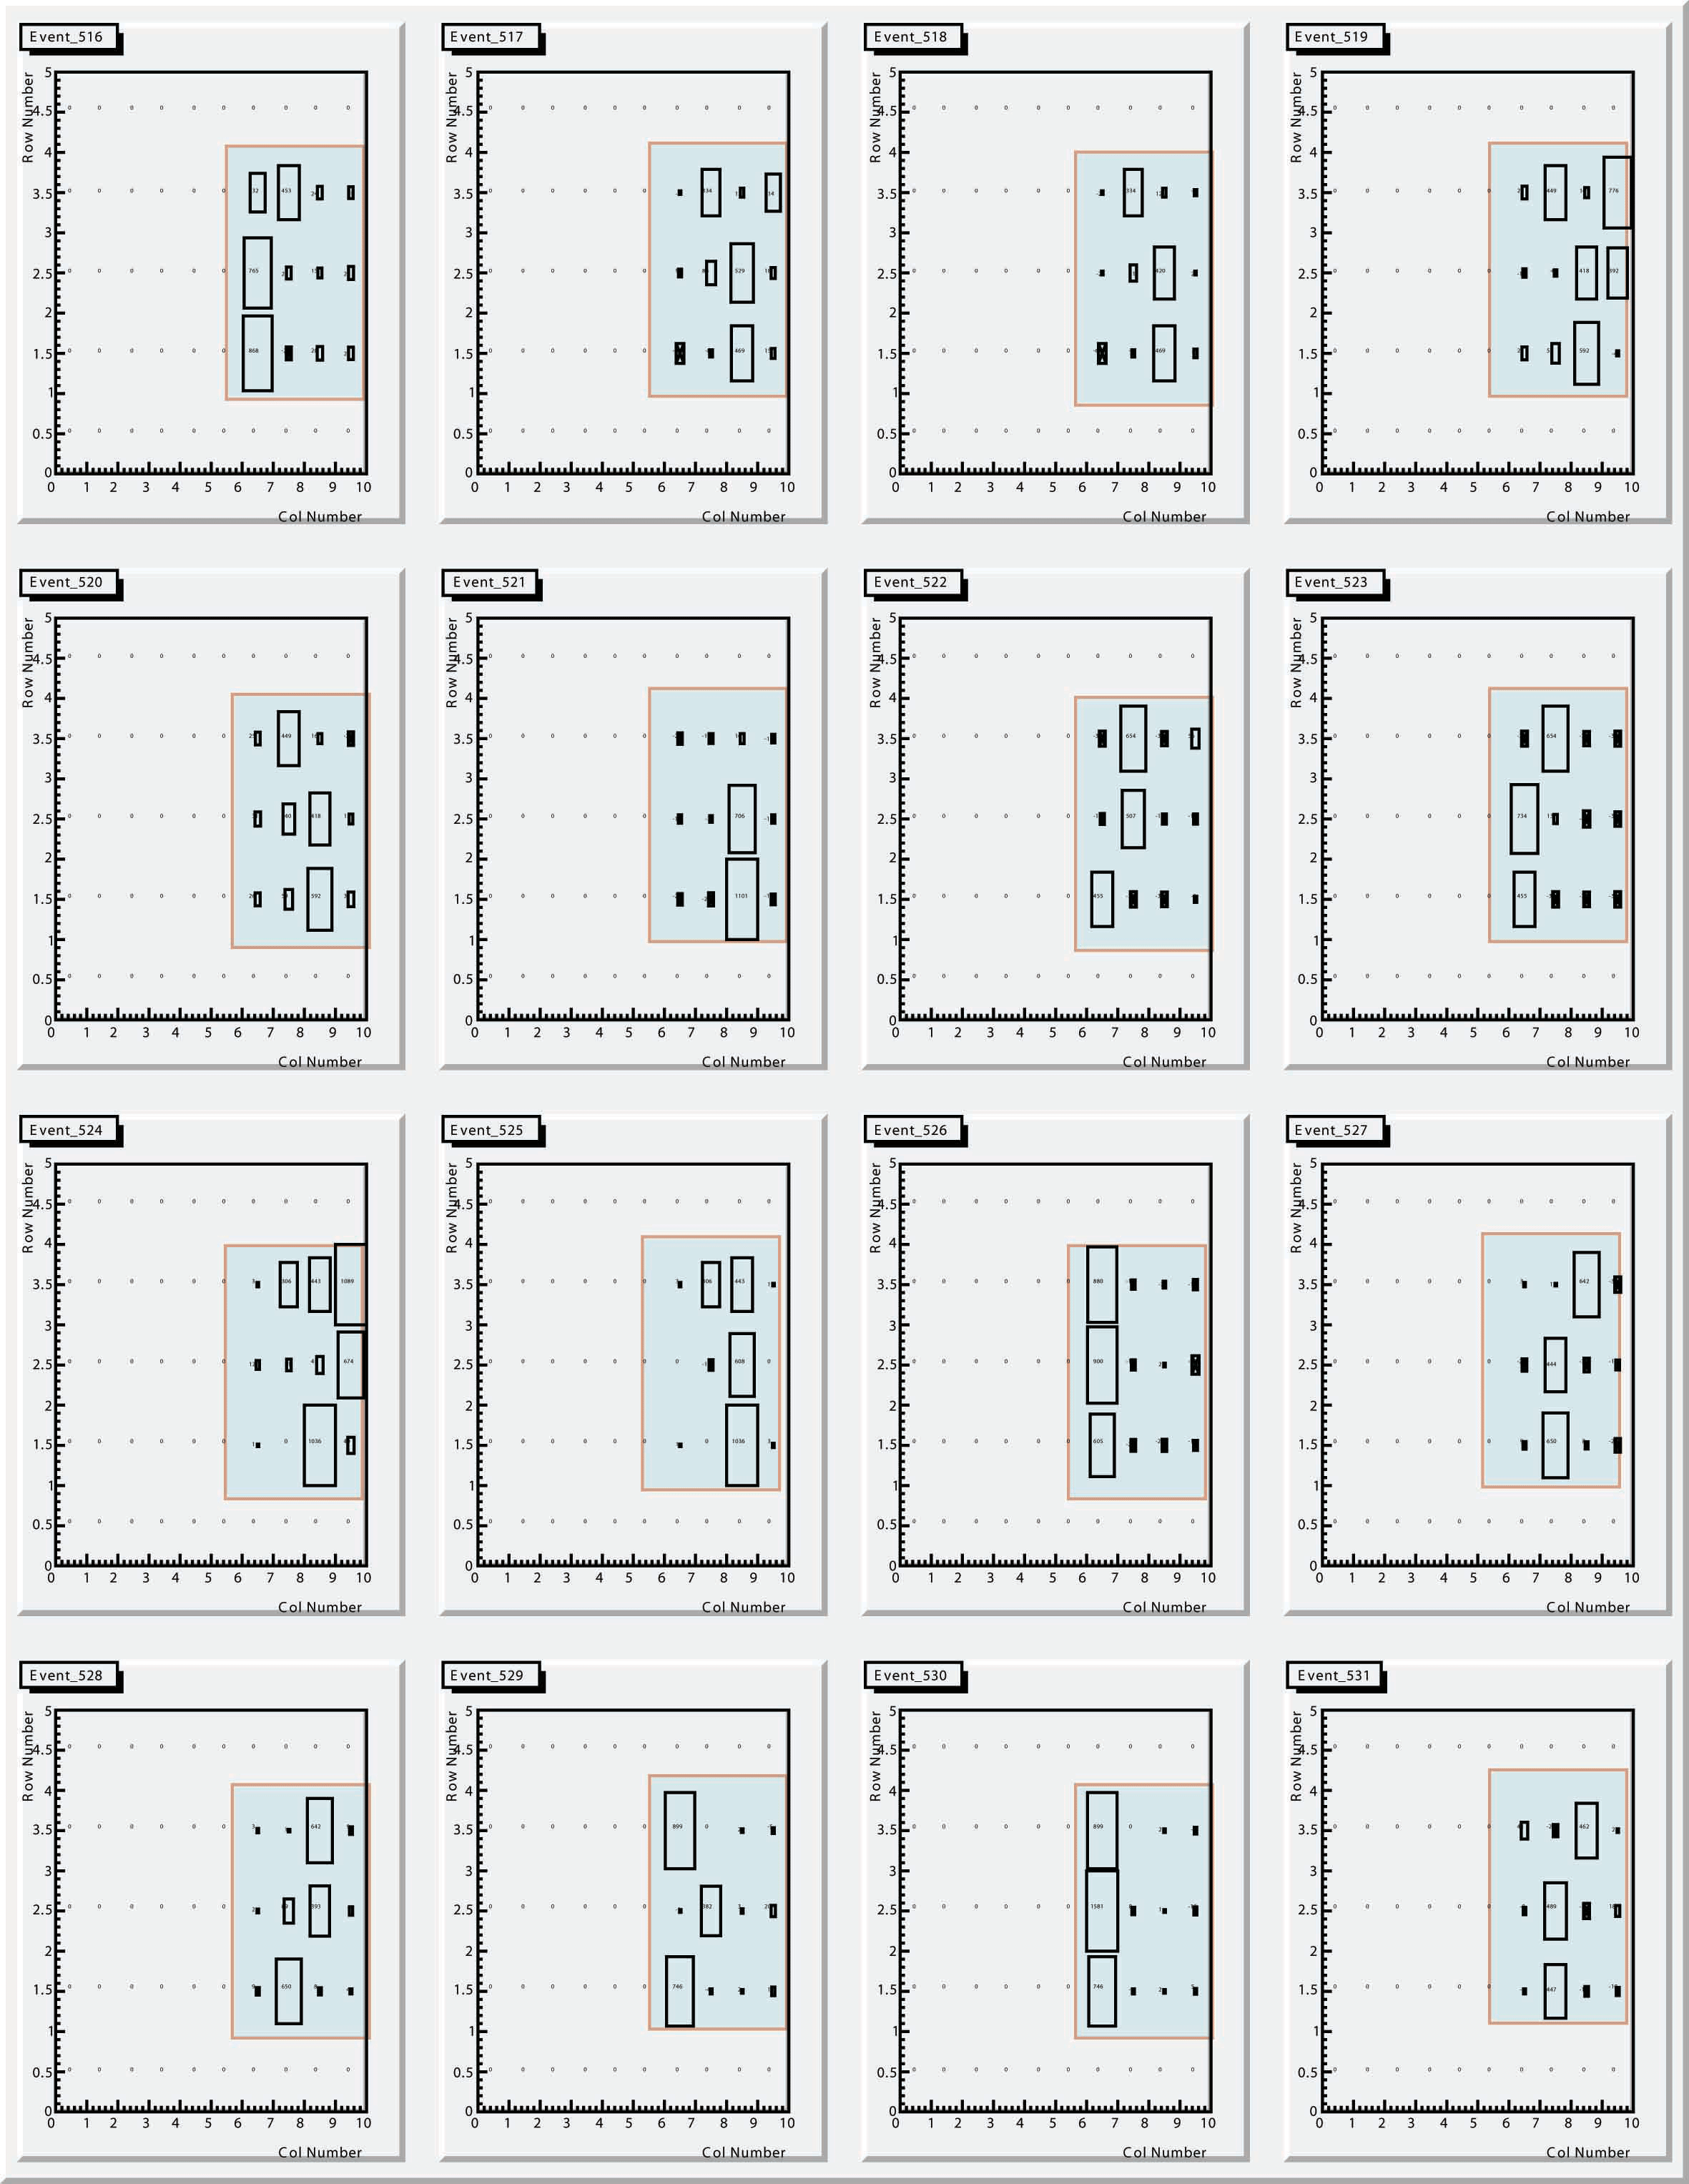
The following figure shows 16 consecutive events in 16 frames. Each frame corresponds to a single trigger and is a 10x5 box histogram with box size measuing the integrated phototube charge (ped subtracted).
If you zoom in on the figures below, in each cell the text indicates the ped subtracted ADC value.
The shaded 4x3 subarray correspond to the 12 channels being read out.
Nearly every event looks like a single, near vertical muon.
To see more detail on a few of these events :
http://www.star.bnl.gov/protected/spin/heppelmann/HCal/events_1.pdf
http://www.star.bnl.gov/protected/spin/heppelmann/HCal/events_2.pdf
Measured ADC Distributions
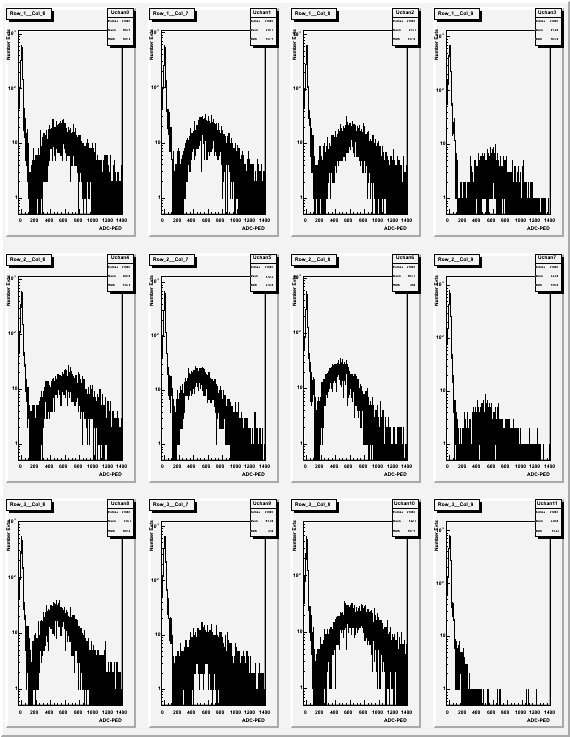
ADC values measure integrated charge and the scale is 25 fC per count.
Events were selected to have exactly 3 cells with more than 100 counts above pedestal. (this is most events).
The ADC distributions are then:
For better resolution Use: http://www.star.bnl.gov/protected/spin/heppelmann/HCal/ADC.pdf
Next Step
1) Over the next week, we will repeat these measurements with varied trigger configurations that will allow us to collect data from all channels.
2) We will attempt to verify the response of each channel as a function of high voltage.
3) We will attempt to use external scintillators to localize the trigger in the "Z" direction and measure the response as a funtion of Z.
- heppel's blog
- Login or register to post comments
