- heppel's home page
- Posts
- 2021
- July (3)
- 2020
- February (1)
- 2019
- 2018
- 2017
- 2016
- December (2)
- November (2)
- October (3)
- September (2)
- August (1)
- July (3)
- June (5)
- May (8)
- April (4)
- March (1)
- February (2)
- January (2)
- 2015
- December (1)
- November (4)
- October (8)
- September (4)
- August (3)
- July (2)
- June (7)
- May (8)
- April (5)
- March (13)
- February (5)
- January (2)
- 2014
- December (1)
- November (2)
- September (1)
- June (3)
- May (2)
- April (1)
- March (3)
- February (2)
- January (1)
- 2013
- 2012
- 2011
- December (2)
- November (1)
- September (2)
- August (3)
- July (2)
- June (6)
- May (2)
- April (2)
- March (3)
- February (3)
- January (3)
- 2010
- December (1)
- November (2)
- September (2)
- August (1)
- July (4)
- June (3)
- May (2)
- April (1)
- March (1)
- February (2)
- January (1)
- 2009
- 2008
- My blog
- Post new blog entry
- All blogs
MoreEtaAnalysis
New Analysis of Run 6 Eta Signal
The PSU software used to analyze the FPD/FMS data has been reorganized in the year since the transverse spin analysis of Run 6 Eta production was presented. We do not believe that any changes in the reconstruction algorithm have occurred with this reorganization. Looking at a few runs reconstructed a year ago and reanalyzed now seem to bear out this assumption.
The East FPD data from the Run 6 transverse proton data set has been reanalyzed with the latest PSU software. This reanalysis will soon be compared with analysis of new simulation of the East FPD.
- The analysis was done with calibration associated with SPIN 08 presentations.
- There is not any non-linear (energy dependent) gain correction applied to the data.
- The data are selected to have two photons within the FPD (no FPD fiducial cut).
- There is a photon energy sharing cut (Z<.8) used for all data shown here.
- A "centercut" is applied to data, selecting data with a 2 photon momentum in the psuedo-rapidity and azimuthal angle range:
sqrt( (Y+3.65)2 + tan(phi)2)<0.15 - The "Eta" signal is defined to have invariant mass .45 GeV < M12 < .65 GeV.
Eta Mass Distributions
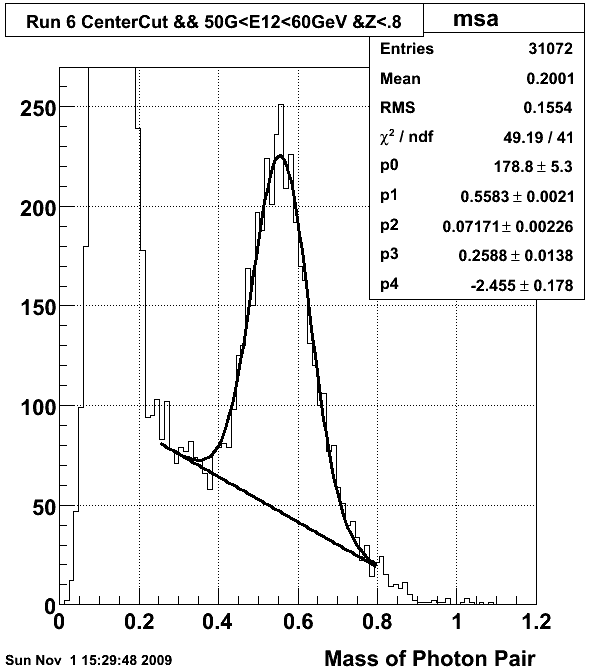
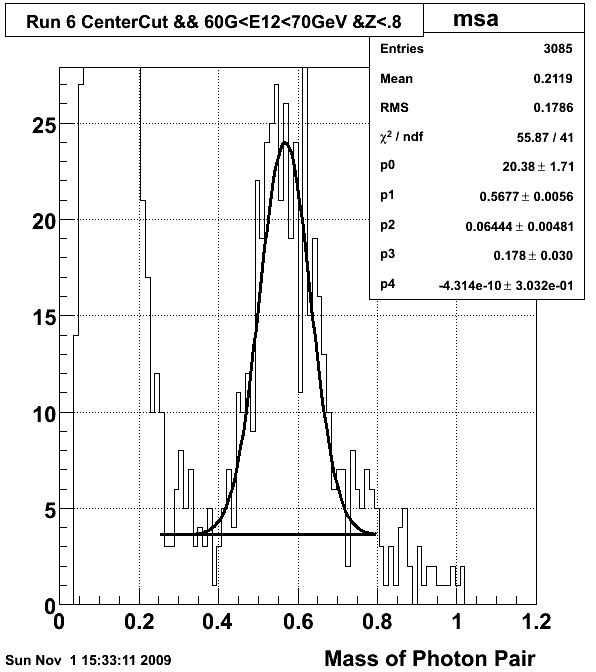
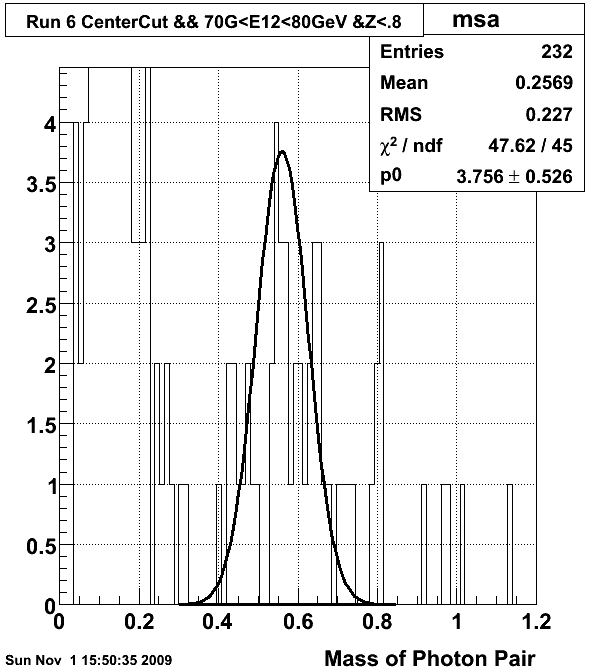
The following three figures show fits to Eta mass peaks for the cuts indicated
- 50 GeV< E12< 60 GeV (5 parameter fit)
- Fitted Mass = 0.558 GeV +/- .002 GeV
- Fitted Width = .0717 GeV +/- .0023
- Fitted Background/Signal @ peak = 25.88 % +/- 1.38%
- chi2/dof = 49.2/41
- 60 GeV < E12 < 70 GeV (5 parameter fit)
- Fitted Mass = 0.568 GeV +/- .006 GeV
- Fitted Width = .064 GeV +/- .0048
- Fitted Background/Signal @ peak = 17.8 % +/- 3%
- chi2/dof = 55.8/41
- 70 GeV < E12 < 80 GeV (1 parameter fit)
- Mass Fixed = 0.56 GeV
- Width Fixed = .065 GeV
- Background Fixed = 0%
- chi2/dof = 47.6/45
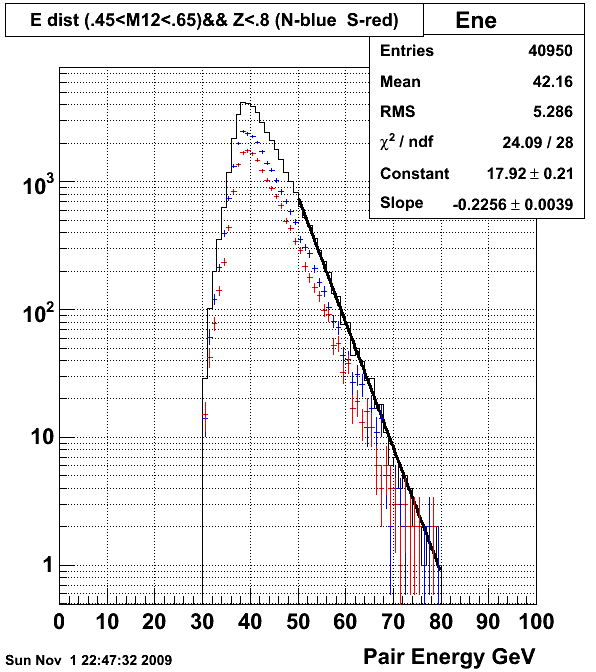
Eta Energy Distributions
The following plot shows the energy distribution for events that satisfy
- There is a photon energy sharing cut (Z<.8) used for all data shown here.
- A "centercut" is applied to data, selecting data with a 2 photon momentum in the psuedo-rapidity and azimuthal angle range:
sqrt( (Y+3.65)2 + tan(phi)2)<0.15 - The "Eta" signal is defined to have invariant mass .45 GeV < M12 < .65 GeV.
The black curve represents the sum of the blue (FPD East-North) and red (FPD East-South) event distributions.
Although this is not corrected for acceptance, the fit to exponential is consistent with the prediction of
invariant cross section proportional to (1-x)5/pt6 , which predicts an exponential slope of -(5+6)/50 for energies in the neighborhood of 50 GeV.
- Fitted slope = -0.226 +/- .004 GeV-1
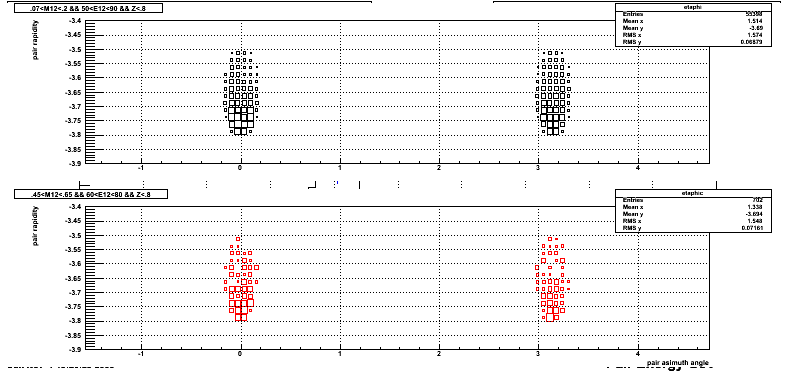
Pseudo-Rapidity and Phi dependence within Center Cut for two photon events in Pi and Eta mass region.
The top (black) of the following plot represents the Pseudo-Rapidity vs Phi distribution for events in the pion mass region (.07 GeV < Mass< 0.2 GeV) and (50 GeV < Energy < 90 GeV).
The Bottom (red) represents the Pseudo-Rapidity vs Phi distribution for events in the Eta mass region (.45 GeV < Mass< 0.65 GeV) and (60 GeV < Energy < 80 GeV).
Analysis of Eta's in (70 GeV< Energy <80 GeV) with (.45 GeV<Mass<.65 GeV) bin.
Number of Events
- North (Yellow up) 9 Events
- South (Yelllow down) 14 Events
- North (Yellow down) 6 Events
- South (Yellow up) 1 Event
AN=(1/polarization) (9+14 - 6 -1)/(9+14+6+1)= (1/0.6) (23 - 7)/(23+7) = 89%
Cross Ratio AN= 1.07
Binomial(M,N,p) = probability of observing M events in N tries where the probability of success is p
If the asymmetry is AN = 0 and we observe 30 events with 0 to 7 counts of one spin, the probability is?
Sum_{j=0,7} Binomial(j,30,0.5) = .0026
Sum_{j=23,30} Binomial(j,30,0.5) = .0026
So probability = 0.005 = 0.5 %
If the asymmetry is AN = 0.3 (Pol=.6) and we observe 30 events with 0 to 7 counts of one spin , what is the probability?
p=.5-(AN*Pol)/2= .5 -(0.3*0.6)/2=.41
Sum_{j=0,7} Binomial(j,30,.41) = .034
Sum_{j=23,30} Binomial(j,30,.41) = 0.
So probability = 0.034 = 3.4 %
If the asymmetry is AN = 0.4 (Pol=.6) and we observe 30 events with 0 to 7 counts of one spin?
p=.5 - (AN*Pol)/2= .5 - (0.5*0.6)/2=.38
Sum_{j=0,7} Binomial(j,30,.38) = .068
Sum_{j=23,30} Binomial(j,30,.38) = 0.
So probability = 0.068 = 6.8 %
Groups:
- heppel's blog
- Login or register to post comments