- heppel's home page
- Posts
- 2021
- July (3)
- 2020
- February (1)
- 2019
- 2018
- 2017
- 2016
- December (2)
- November (2)
- October (3)
- September (2)
- August (1)
- July (3)
- June (5)
- May (8)
- April (4)
- March (1)
- February (2)
- January (2)
- 2015
- December (1)
- November (4)
- October (8)
- September (4)
- August (3)
- July (2)
- June (7)
- May (8)
- April (5)
- March (13)
- February (5)
- January (2)
- 2014
- December (1)
- November (2)
- September (1)
- June (3)
- May (2)
- April (1)
- March (3)
- February (2)
- January (1)
- 2013
- 2012
- 2011
- December (2)
- November (1)
- September (2)
- August (3)
- July (2)
- June (6)
- May (2)
- April (2)
- March (3)
- February (3)
- January (3)
- 2010
- December (1)
- November (2)
- September (2)
- August (1)
- July (4)
- June (3)
- May (2)
- April (1)
- March (1)
- February (2)
- January (1)
- 2009
- 2008
- My blog
- Post new blog entry
- All blogs
FMS Time Dependent Gain Run 9 day 173
I have analyzed the LED signals from two runs on day 173 of Run 9.
Run 10173048 (Event 1-600000)
| Start Time | Mon Jun 22 12:15:58 EDT [ 2009-06-22 16:15:58 GMT ] | |
| Stop Time | Mon Jun 22 12:34:09 EDT [ 2009-06-22 16:34:09 GMT ] |
Run 10173053 (Event 600000-2000000)
| Start Time | Mon Jun 22 13:18:47 EDT [ 2009-06-22 17:18:47 GMT ] | |
| Stop Time | Mon Jun 22 14:01:50 EDT [ 2009-06-22 18:01:50 GMT ] | |
I plot the gains as a function of run number and event number as defined above.
I identify the low ADC band (of 3 bands)
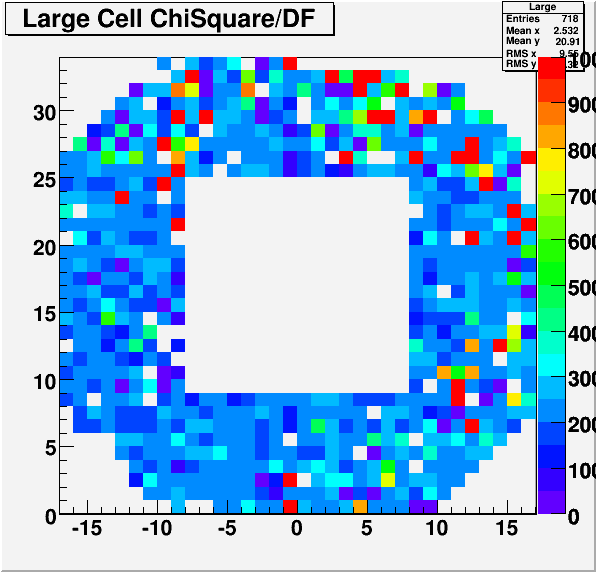
1) I fit the time dependence of LED gains for the above sequence of data to a straight line.
Large chi2 of the fit is an indication of random jumps in gain.
In the following figure, the chi2/df for this fit is plotted for each Large cell FMS channel.
The Red cells are the ones that have gain jumps.
Tan and yellow cells show time dependence but are probably not a problem for operation.
There are fewer channels (~5) that have gain change by more than about 20% over this period (based on slope of fit)
The left part of this figure is FMS North
The bottom of this Figure is FMS top
Cells for which my algorithm for finding or interpreting LED signals failed are shown as white. (Some may have overflowed my histograms)
STAR/files/userfiles/1651/file/RedZener.gif

Here are the details on the North half of the large cells.
STAR/files/userfiles/1651/file/NorthLed3.ppt
The above powerpoint examines the "bad" cells on the North half of the FMS in detail.
My conclusion is that
1) Out of ~15 large cells that are in question on the North only about 3 actually impact
the trigger rate in an observable way.
2) Even the changes in the worst 3 channels do not impact the total trigger rate significantly.
3) Some of the small and slower variations are likely variations in our measurement of gain, not actual gain.
- heppel's blog
- Login or register to post comments
