- heppel's home page
- Posts
- 2021
- July (3)
- 2020
- February (1)
- 2019
- 2018
- 2017
- 2016
- December (2)
- November (2)
- October (3)
- September (2)
- August (1)
- July (3)
- June (5)
- May (8)
- April (4)
- March (1)
- February (2)
- January (2)
- 2015
- December (1)
- November (4)
- October (8)
- September (4)
- August (3)
- July (2)
- June (7)
- May (8)
- April (5)
- March (13)
- February (5)
- January (2)
- 2014
- December (1)
- November (2)
- September (1)
- June (3)
- May (2)
- April (1)
- March (3)
- February (2)
- January (1)
- 2013
- 2012
- 2011
- December (2)
- November (1)
- September (2)
- August (3)
- July (2)
- June (6)
- May (2)
- April (2)
- March (3)
- February (3)
- January (3)
- 2010
- December (1)
- November (2)
- September (2)
- August (1)
- July (4)
- June (3)
- May (2)
- April (1)
- March (1)
- February (2)
- January (1)
- 2009
- 2008
- My blog
- Post new blog entry
- All blogs
Run12 LED vs Time
The LED time dependence is now being systematically tracked in the PSU code.
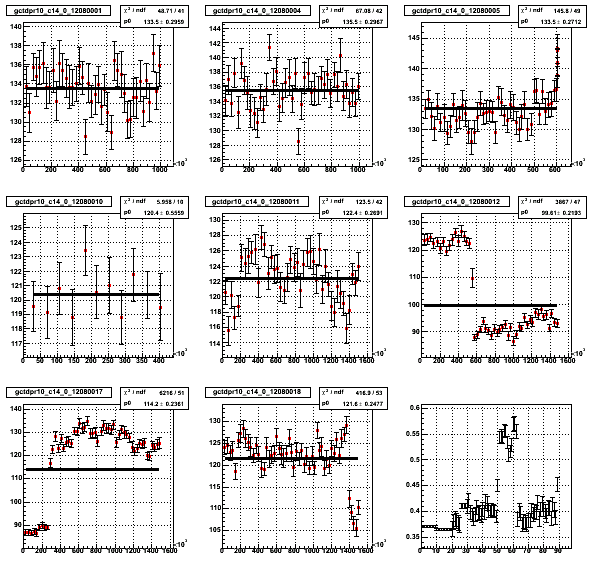
The time dependence of a problem cell (NSTB=1, row=10,col=14) is shown below for day 80 data.
The first 8 frames are time dependent LED signals (groups of 40 led events) from day 80.
The lower right frame shows the trend over these 8 runs.

For example, one channel in Small South (row18 col7) is plotted below with a point plotted for every 40 LED events, (~1 min).
The x axis is day number.

Notice that there is a drop of about 20% from day 80 to day 95.
The question is: Does this represent a variation of LED pulse or a variation of gain?
I address this by looking at the average adc value for a channel on day 80 and day 96 and compare to the LED value for the same two days.
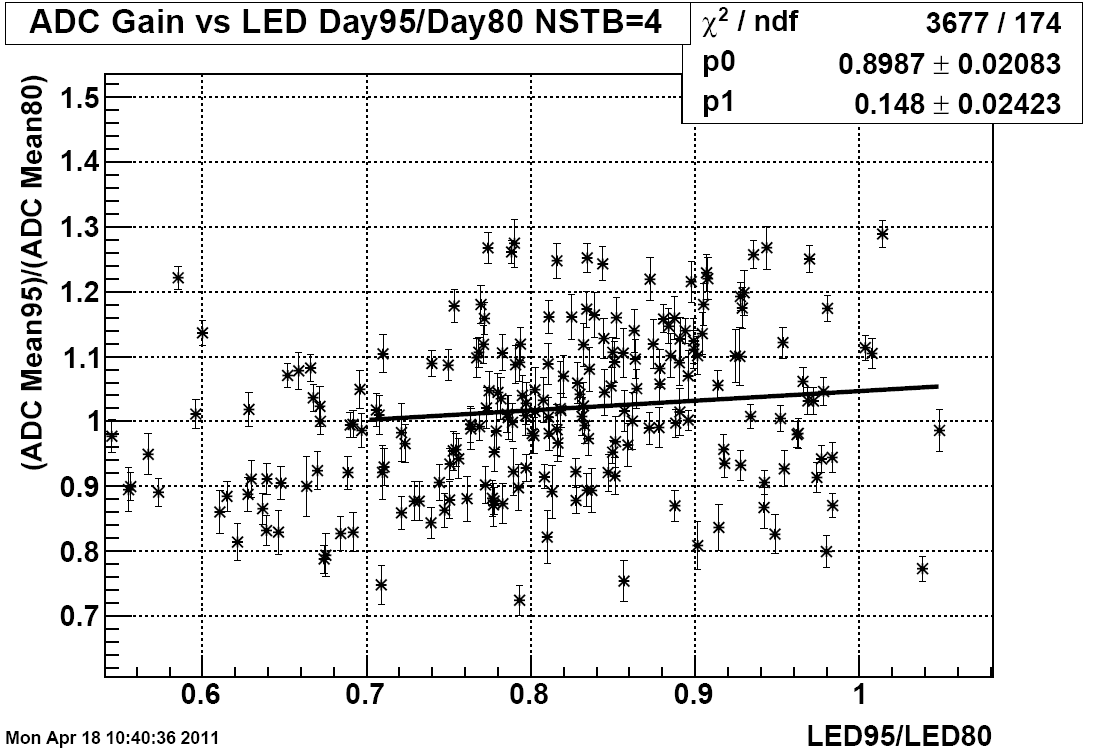
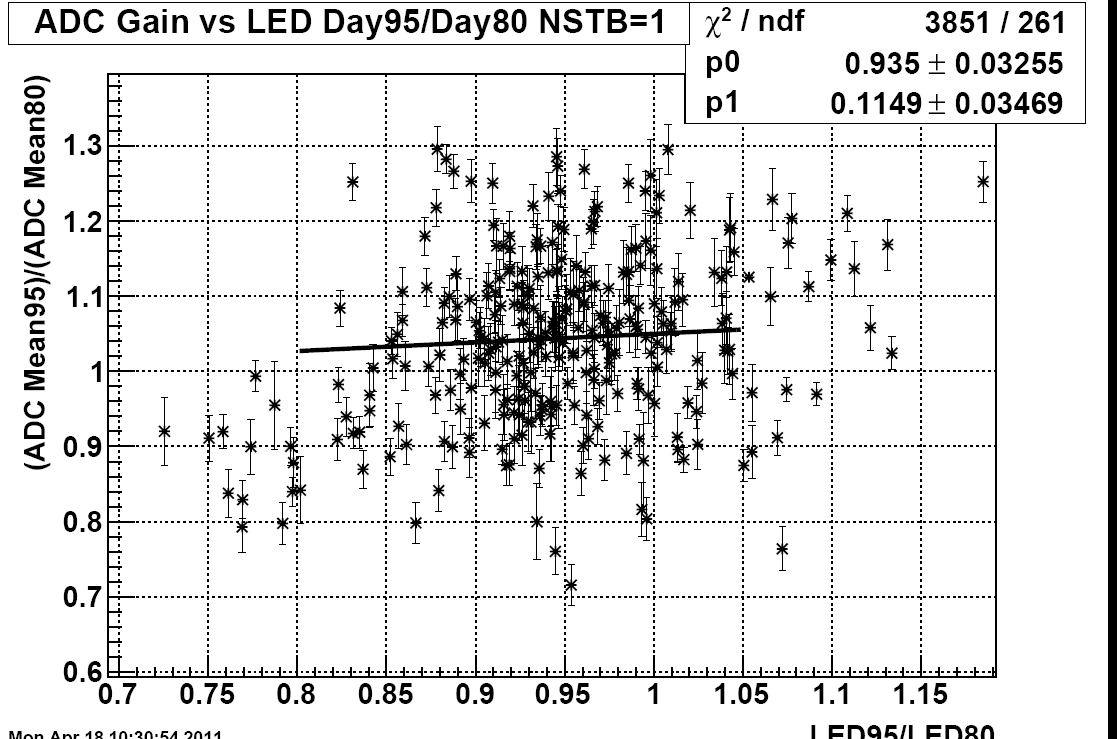
The following plot shows a comparison between two runs (12080001 12095006)
The x axis is the ratio of Day 95 to Day 80 LED
The y axis is the ratio of Day 95 to Day 80 Average ADC
The first plot of shows all channels for NSTB=4 where no short term LED drift is seen
The second plot is for NSTB=1 where short term LED drift is seen


Conclusion: Little of the large drift in LED pulse height is due to real gain changes!
- heppel's blog
- Login or register to post comments
