- heppel's home page
- Posts
- 2021
- July (3)
- 2020
- February (1)
- 2019
- 2018
- 2017
- 2016
- December (2)
- November (2)
- October (3)
- September (2)
- August (1)
- July (3)
- June (5)
- May (8)
- April (4)
- March (1)
- February (2)
- January (2)
- 2015
- December (1)
- November (4)
- October (8)
- September (4)
- August (3)
- July (2)
- June (7)
- May (8)
- April (5)
- March (13)
- February (5)
- January (2)
- 2014
- December (1)
- November (2)
- September (1)
- June (3)
- May (2)
- April (1)
- March (3)
- February (2)
- January (1)
- 2013
- 2012
- 2011
- December (2)
- November (1)
- September (2)
- August (3)
- July (2)
- June (6)
- May (2)
- April (2)
- March (3)
- February (3)
- January (3)
- 2010
- December (1)
- November (2)
- September (2)
- August (1)
- July (4)
- June (3)
- May (2)
- April (1)
- March (1)
- February (2)
- January (1)
- 2009
- 2008
- My blog
- Post new blog entry
- All blogs
Aug 15
1) All of the Run 11 two photon reconstruction shown to this point is with all clusters set to catagory 1, which means that each cluster is treated as a separate photon. This is good for reconstruction of 30-40 GeV Pi0's for the purpose of calibrating.
Last week, I tried to turn full catagories back on and found it was broken. All clusters were treated as one photon by default unless I force it explicitly. This was a bug that was introduced last summer while we were reorganizing code.
Anyhow, the bug is fixed in the latest distribution (see Aug 11 entry)
drupal.star.bnl.gov/STAR/blog/heppel/2011/jun/15/fms-root12fms-versions
The pi0 mass peak, will now be aggressively reconstructed, with separation between pi0 and single-photon based on sigmamax as usual.
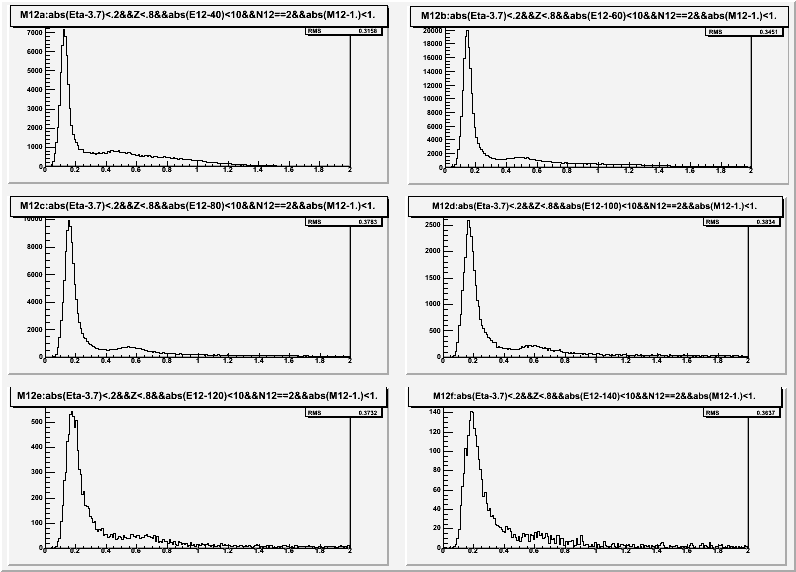
This is what the 2 photon mass distribution looks like now at energies 40,60,80,100,120,140 GeV (upper left 40, lower right 140). The mass plots are based on about 15 Runs.

We have resubmitted reconstruction jobs for the standard 300 runs with these changes.
At this time, a little less that half of them have completed and the following plots preview this reanalysis.
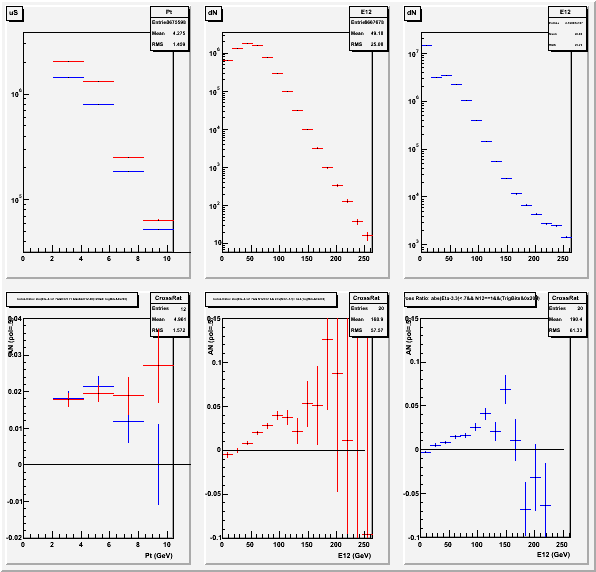
Here are the asymmetry results based on estimated polarization of 50% and <cos(phi)>=.8
In each case, red corresponds to selected pi0's based on full multi-catagory reconstruction, blue represents the single photon events according to this algorithm.
The left column shows how the event distribution (upper) and asymmetry (lower) depends on Pt. Events in the left column are selected to have energy 60GeV<E12<100GeV.
The center and right columns show how these variables depend on energy again red and blue are for pi0 and single photon respectively. The upper plots are event distributions and the bottom ones are the Aysmmetries (pol=50% <cos(phi)>=.8).

- heppel's blog
- Login or register to post comments
