- heppel's home page
- Posts
- 2021
- July (3)
- 2020
- February (1)
- 2019
- 2018
- 2017
- 2016
- December (2)
- November (2)
- October (3)
- September (2)
- August (1)
- July (3)
- June (5)
- May (8)
- April (4)
- March (1)
- February (2)
- January (2)
- 2015
- December (1)
- November (4)
- October (8)
- September (4)
- August (3)
- July (2)
- June (7)
- May (8)
- April (5)
- March (13)
- February (5)
- January (2)
- 2014
- December (1)
- November (2)
- September (1)
- June (3)
- May (2)
- April (1)
- March (3)
- February (2)
- January (1)
- 2013
- 2012
- 2011
- December (2)
- November (1)
- September (2)
- August (3)
- July (2)
- June (6)
- May (2)
- April (2)
- March (3)
- February (3)
- January (3)
- 2010
- December (1)
- November (2)
- September (2)
- August (1)
- July (4)
- June (3)
- May (2)
- April (1)
- March (1)
- February (2)
- January (1)
- 2009
- 2008
- My blog
- Post new blog entry
- All blogs
Time Dependence of FMS Pulser Data (Sun Jan 16)
The following runs were collected Sunday Night Jan 16 over a 3 hour period with the STAR magnet on. The data were collected at an event rate of about 3 HZ with runs of 1000 events, assigned event numbers from 1 to 1000.
The variable
The variable
X=(RunNum-12016000)*1000+Evtnum
is essentially time in units of 1/3 second, with jumps when the run and HV is changed.
(RunNum, LargeHV,SmallHV}
{12016005, 1600, 0xFF},
{12016006, 1600, 0x00},
{12016007, 1575, 0x10},
{12016008, 1550, 0x20},
{12016009, 1525, 0x30},
{12016010, 1500, 0x40},
{12016011, 1475, 0x50},
{12016012, 1450, 0x60},
{12016013, 1425, 0x70},
{12016014, 1600, 0x80},
{12016015, 1600, 0x90},
{12016016, 1600, 0xA0},
{12016017, 1400, 0xB0},
{12016018, 1375, 0xC0},
{12016020, 1350, 0xD0},
{12016021, 1325, 0xE0},
{12016022, 1300, 0xF0},
{12016023, 1275, 0xFF},
{12016026, 1250, 0xFF},
{12016027, 1225, 0xFF},
{12016028, 1200, 0xFF},
{12016029, 1175, 0xFF},
{12016030, 1150, 0xFF},
{12016031, 1125, 0xFF},
{12016032, 1100, 0xFF},
{12016033, 1050, 0xFF},
{12016034, 1000, 0xFF}
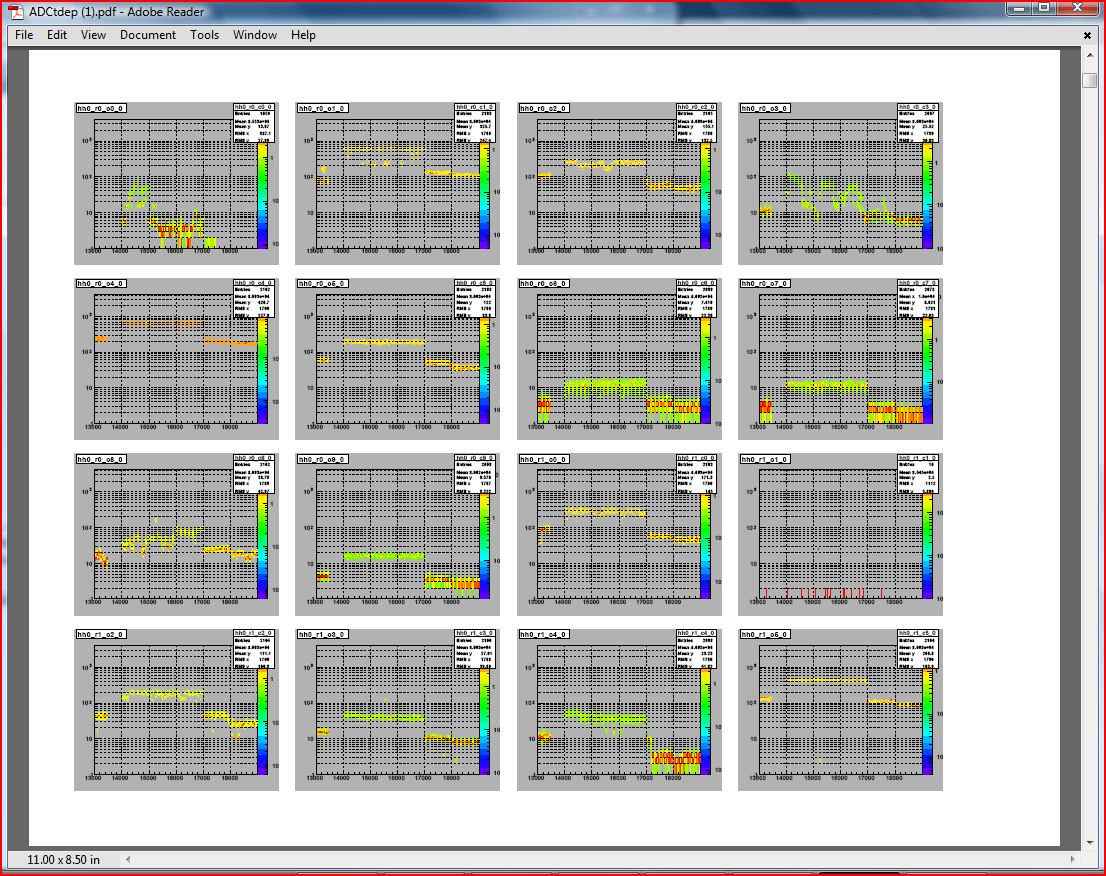
For each channel in runs 12016013 through 12016018 we plot the ADC distribution vs X (8Mb pdf) . The time range is about 40 Min.
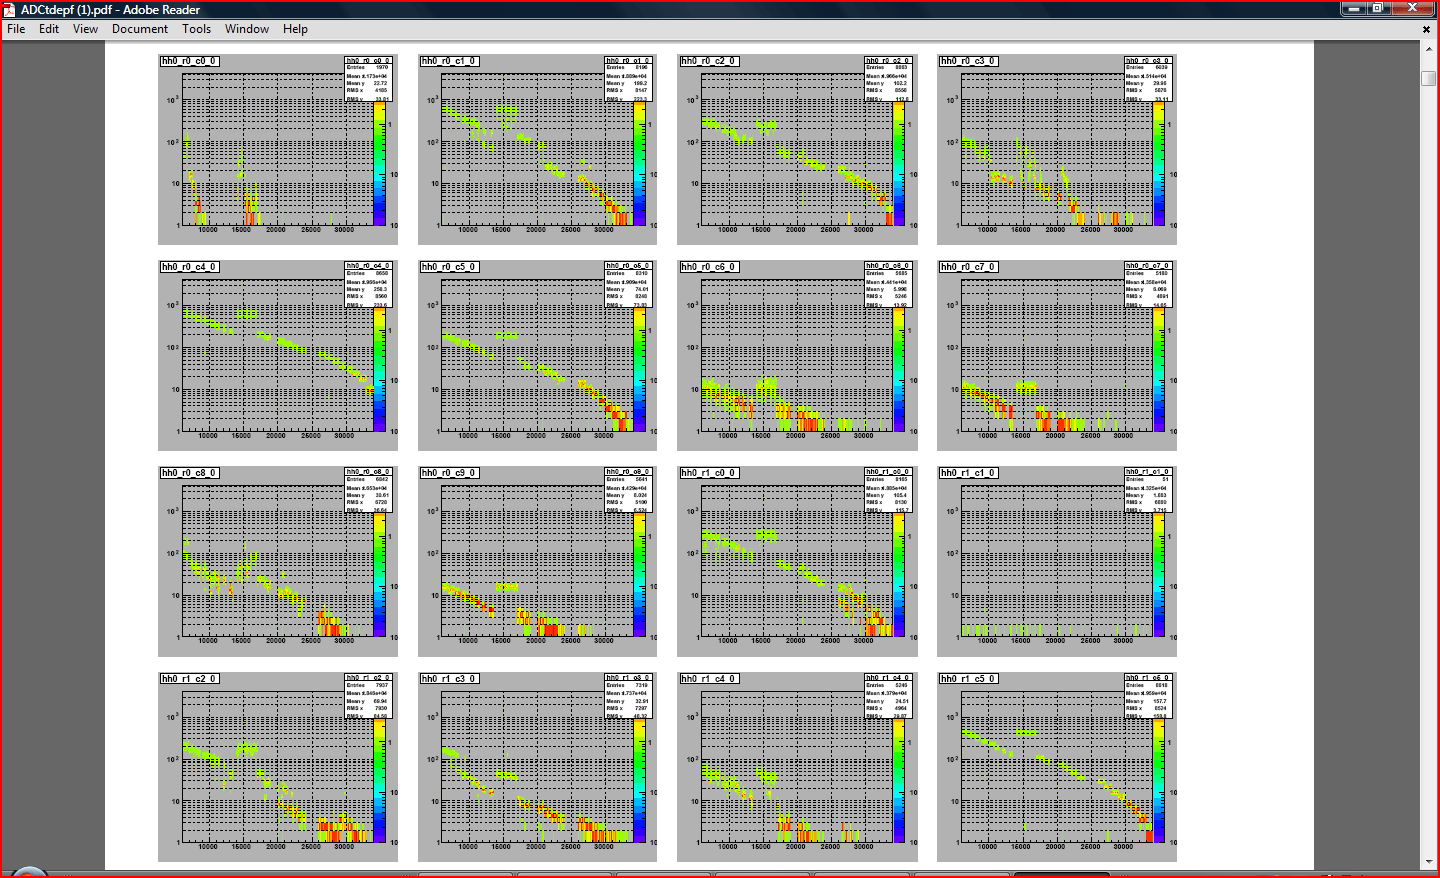
A larger plot (22Mb pdf ) is similar but includes all these runs and the full 3 hour period for each channel. These results can be (have been) plotted as
adc vs set voltage . However, if the gains are jumping around during the time of measurement, then these gain-voltage plots are less meaningful.
Each page of these plots includes 16 cells of ADC data. Lets look at th first page of the 3 hour plot (A larger plot)

To check for time independent response of large cells, we look at the 40 min Plot.

So we are looking for problem cells where time dependence of ADC is seen between X=14000 && 17000, where the Large Cell High Voltage is constant at 1600 Volts.
So of the first 16 large cells, which cells are showing clear instability? The plots shown above are pages 2 of the linked pdf files.
1) r0_c0_0 (Row=0 Col=0 NSTB=1) clearly instable +-100%
2) r0_c1_0 we need to look at it. Sometimes drops to 1/3 value.
3) r0_c2_0 we need to look at it. Some anomalous points but overall not too bad.
4) r0_c3_0 Looks instable +- 100%
9) r0_c8_0 Instable +- 50%
bad ratio 3/16
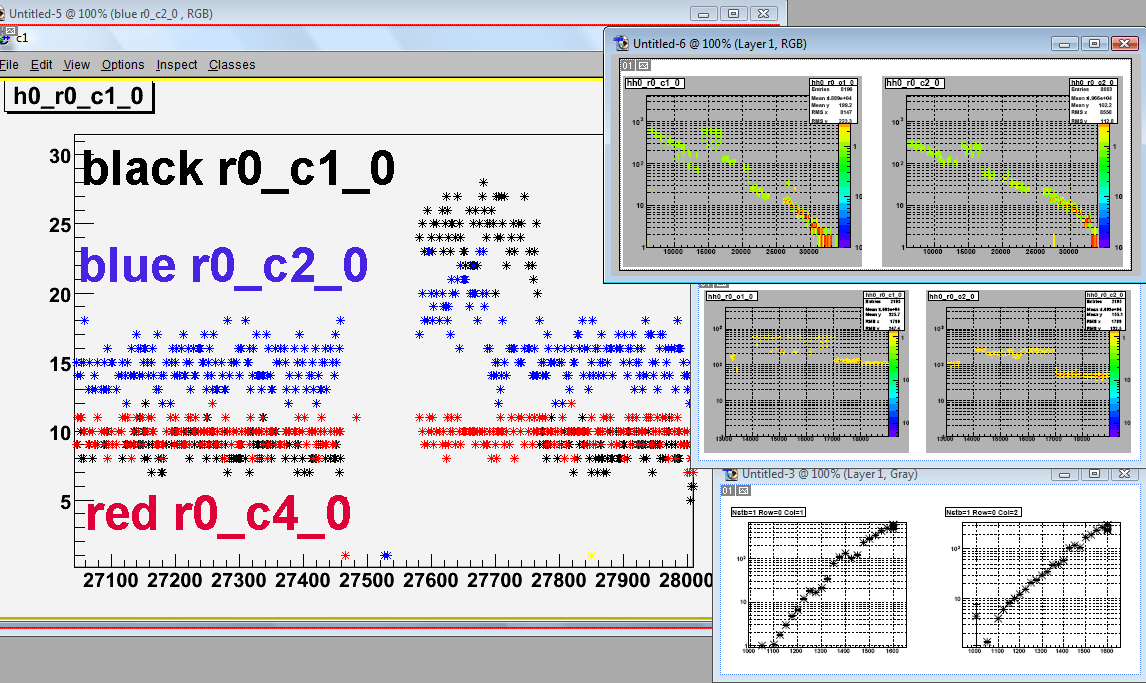
Look at 2) and 3), which are not good but not too bad, it seems that some of the jumps are correlated. In particular, during run 12016027, there is a correlated jump in 2) black and 3) blue. The red is a stable channel.

Unstable Cells in the second group of 16 Cells
6) r2_c0_0
9) r2_c3_0
11) r2_c5_0 dropouts?
12) r2_c6_0
NEXT 16
5) r3_c3_0
11) r3_c9_0
13) r3_c13_0 noisy but ok
NEXt 16
3) r4_c4_0
4) r4_c5_0
6) r4_C7_0
NEXT 16
4) r5_c7_0 some dropouts but ok
5) r5_c8_0
9) r5_c12_0
12) r6_c0_0
15) r6_c3_0
16) r6_c4_0
NEXT 16
3) r6_c7_0
6) r6_c10_0
15) r7_c3_0
NEXT 16
15) r8_c2_0
NEXT 16
15) r9_c9_0
16) r9_c10_0
NEXt 16
1) R9_c11_0
4) r9_C14_0
7) r10_c8_0
9) r10_c11_0
12) r10_c13_0
13) r10_c14_0
NEXT 16
2) r11_c10_0
3) r11_c11_0
13) r12_c12_0
NEXT 16
5) r13_c11_0
16) r14_c13_0
NEXT 16
9) r15_c13_0
11) r15_15_0
15) r16_11_0
NEXT 16
2) r16_c13_0
NEXT 16
3) r18_c12_0
4) r18_c13_0
NEXT 16
6) r20_c13_0
10) r21_c8_0
NEXT 16
9) r22_c14_0
13) r23_c9_0
15) r23_c11_0
NEXT 16
14) r25_c0_0
NEXT 16
NEXT 16
7) r26_c8_0
NEXT 16
1) r27_c1_0
NEXt 16
7) R28_C7_0
NEXT 16
NEXT 16
NEXT 16
NEXT 16
5) r33_c4_0
NEXT 16
14) r1_c9_1
NEXT 16
3) r2_c3_1
10) r2_c10_1
11) r2_c11_1
NEXT 16
2) r3_c6_1
10) r4_c1_1
11) r4_c2_1
NEXT 16
5) r4_c12_1
12) r5_c5_1
NEXT 16
4) r5_c13_1
15) r6_c9_1
16) r6_c10_1
NEXT 16
2) r6_c12_1
12) r7_c6_1
NEXT 16
4) r7_c15_1
8) r8_c1_1
NEXT 16
2) r8_c11_1
4) r8_c13_1
9) r9_c9_1
NEXt 16
3) r0_c10_1
15) r11_c13_1
16) r11_c14_1
NEXT 16
4) r12_c9_1
7) r12_c12_1
9) r12_c14_1
10) r12_c12_1
15) r13_c11_1
16) r13_c12_1
NEXT 16
3) r13_c15_1
7) r14_c10_1
14) r15_C8_1
NEXT 16
3) r15_c13_1
14) r16_c16_1
NEXT 16
2) r17_c10_1
7) r17_c15_1
11) r18_c10_1
NEXT 16
6) r19_c12_1
12) r20_c9_1
15) r20_c12_1
NEXT 16
1) r20_c14_1
2) r20_c15_1
4) r21_c8_1
14) r22_c9_1
NEXT 16
10) r23_c12_1
NEXT 16
3) r24_c12_1
4) r24_c13_1
5) r24_c14_1
7) r24_c16_1
NEXT 16
11) r26_c2_1
NEXT 16
NEXT 16
NEXT 16
1) 28_c7_1
NEXT 16
1) r29_c8_1
3) r29_c10_1
NEXT 16
11) 31_c7_1
NEXT 16
10) r32_c10_1
NEXT 16
TOTAL ~ 100 "short term" unstable Large Cells ~ 14%
Groups:
- heppel's blog
- Login or register to post comments
