- heppel's home page
- Posts
- 2021
- July (3)
- 2020
- February (1)
- 2019
- 2018
- 2017
- 2016
- December (2)
- November (2)
- October (3)
- September (2)
- August (1)
- July (3)
- June (5)
- May (8)
- April (4)
- March (1)
- February (2)
- January (2)
- 2015
- December (1)
- November (4)
- October (8)
- September (4)
- August (3)
- July (2)
- June (7)
- May (8)
- April (5)
- March (13)
- February (5)
- January (2)
- 2014
- December (1)
- November (2)
- September (1)
- June (3)
- May (2)
- April (1)
- March (3)
- February (2)
- January (1)
- 2013
- 2012
- 2011
- December (2)
- November (1)
- September (2)
- August (3)
- July (2)
- June (6)
- May (2)
- April (2)
- March (3)
- February (3)
- January (3)
- 2010
- December (1)
- November (2)
- September (2)
- August (1)
- July (4)
- June (3)
- May (2)
- April (1)
- March (1)
- February (2)
- January (1)
- 2009
- 2008
- My blog
- Post new blog entry
- All blogs
New Code for LED Time Dependence
Time Dependence of FMS ADC
I am working on a proceedure for including time dependenced as we read FMS ADC data into the PSU analysis package.
Most of the work is completed but testing is still underway. My working directory, with evolving code is at "~heppel/ABatch/root12fms"
At the heart of the proceedure are two new classes included in the Fpdchan.so lib package from FpdRoot source code.
New classes are defined in
"RunDepCor.h" and "CellTDep.h"
I have modified man MkRun sequence to make a special pass throuth the data to include a new LED tree file. The current version of MkLed gets these LED tree files without any other processing and without Condor.
The LED tree ends up with a path like:
/star/u/heppel/psu/heppel/files12080001/12080001_1/adcTrL.root
All segments from a run are combined with hadd to create a tree file of the same structure
/star/u/heppel/psu/heppel/files12080001/adcTrL.root
Each instance of the Class CellTDep represents the led history of one cell for one run.
Each instance of the Class RunDepCor contains the history of one run, with a collection of CellTDep instances for all cells.
RunDepCor can be streamed to a root file, currently called RunDep.root and given a name like RDC12080001, including the run number in the name. The RunDep.root file grows by ~800kbytes for each stored run history.
Her is a set of steps to create the RunDep.root file.
1) The MkRun (~heppel/ABatch/root12fms/MkRun) batch submit (including the Mkfiles script ) contains changes that run an analysis pass that creates an adcTrL.root file for each 10k trigger file seqment. I will eventually set up environment variables so we can run "only" the LED pass, which should be very quick. As a result, all above mentioned adcTrL.root files are created.
2) The RunDepCor instance is made with the adcTrL.root file for a complete run as an input. A macro that puts 8 runs of LED data into a RunDep.root file is called tstinit.C and is found here. After this runs, the root file RunDep.root can be opened in root.
Unles you ".x start.C" in root, the classes will not be known to root. In root, you can type ".ls"
We see that this example did produce 8 instances of RunDepCor for 8 runs on day 80.
It is seen in tstinit.C that the constructor for RunDepCor takes 3 or 4 arguments. The arguments are
- Run Number
- path for adcTrL.root
- a representation of the current FpdCor.txt (CalibStr*) gcor
- optionally a pointer to another RunDepCor object which will serve as the "baseline" for time dependence. The baseline LED ADC count for each cell is the run average of that found in the baseline RunDepCor object. The time dependent correction factor will be the ratio of the baseline value to the current LED ADC. If this argument is omitted, this object becomes its own baseline. All objects that are to be compared in a single analysis should have the same baseline object.
Upon creation of each RunDepCor instance, about 1200 instances of the CellTDep class are also created.
These are accessed by, for example,
CellTDep* ct=RDC12080010->Cdep(nstb,row0,col0)
To see the graph generated for cell (nstb,row0,col0), the command would be
RDC12080011->Cdep(nstb,row0,col0)->GetGraph()->Draw("A*")
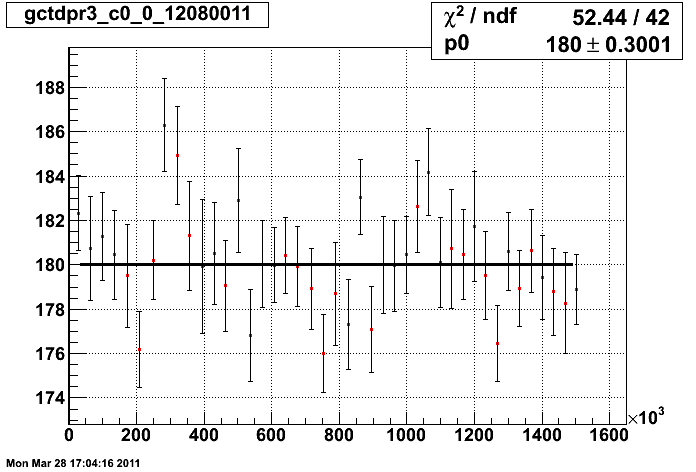
for nstb=1,row0=3,col0=0 this looks like

Note: For this channel, Chi2/DOF is pretty good for a fit to a constant. The errors on individual points is about 1%. The error of the fit to a the mean is about 0.2%.
A basic function of the RunDepCor class is FixFactor:
Float_t correction_factor= RDC12080011->Cdep(nstb,row0,col0)->FixFactor( Segnum, Evtnum, mode)
which for Run 120800011 returns the ratio of base LED ADC to current LED ADC for the indicated "nstb,row0,col0" and for the indicated segment and event number (within 10k segment).
Currently mode=1 and 2 are defined.
mode 1: returns the ratio based on the average over the entire run. Here the error in the mean is usually much less than 1 %. All events in a given run will return the same factor.
mode 2: is the same as mode 1 if the chi2/dof of the fit to a constant is less than 2. Otherwise, what is returned is the point from the graph that is nearest to "Segnum, Evtnum". If an individual point is used, the error usually is about 1-2 %.
Reading ADC's
In a typical application, we read the QT data (ADC's) and convert to energy with nominal gain and gain corrections based upon information in the files associated with environment variables, $FMSGAIN and $FMSCORR.
We can access a gain correction structure with calibration information with the following.
Example looking at a Cell over 8 Runs.
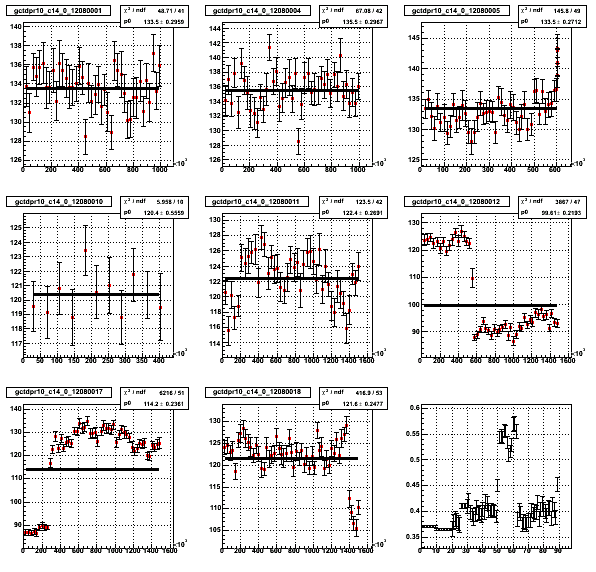
There is an example script that reads the RunDep.root file, with 8 RunDepCor entries, runs from 12080001 - 12080016.
This script makes 8 plots shown below, one for each run and a 9'th plot which samples events through the 8 run entries and plots the results.
The entries in the 9'th and final plot are obtained with the RunDepCor::GetCor(...) function using mode 2. The x axis on the 9'th plot is a sequence number that spans the full set of 8 runs, sampling every 100k events.
Runs 12080001 and 12080004 have good fits to a constant and are plotted in the 9'th plot based on the averate ADC value for runs 12080001 and 12080004. The last 6 runs are plotted in the 9'th plot as individual points from plots 3-8.

Other examples:
- An example from small cells www.star.bnl.gov/protected/spin/heppelmann/tmp/RunDep/c_5_9_2.pdf for Small North row 5 col 9. As seen in the 9'th plot, the GainCor correction for this cell is about 1.5 with variations of about 1-2 %. For Run 12080005 (third plot) the chi2/dof is above 2 and we plot this run data with individual points from plot 3.
- An example from large cells http://www.star.bnl.gov/protected/spin/heppelmann/tmp/RunDep/c_5_9_1.pdf for Large South row 5 col 9. GainCor correction for this cell varies in the range from .80 and .92.
- Worst case: South large row 31 col 7: http://www.star.bnl.gov/protected/spin/heppelmann/tmp/RunDep/c_31_7_1.pdf
Next Step
The next step will be to configure the standard batch processing of trigger files and the gain correction iteration to use the time dependent corrections from this file. This is well underway and I will report soon.
- heppel's blog
- Login or register to post comments
