- heppel's home page
- Posts
- 2021
- July (3)
- 2020
- February (1)
- 2019
- 2018
- 2017
- 2016
- December (2)
- November (2)
- October (3)
- September (2)
- August (1)
- July (3)
- June (5)
- May (8)
- April (4)
- March (1)
- February (2)
- January (2)
- 2015
- December (1)
- November (4)
- October (8)
- September (4)
- August (3)
- July (2)
- June (7)
- May (8)
- April (5)
- March (13)
- February (5)
- January (2)
- 2014
- December (1)
- November (2)
- September (1)
- June (3)
- May (2)
- April (1)
- March (3)
- February (2)
- January (1)
- 2013
- 2012
- 2011
- December (2)
- November (1)
- September (2)
- August (3)
- July (2)
- June (6)
- May (2)
- April (2)
- March (3)
- February (3)
- January (3)
- 2010
- December (1)
- November (2)
- September (2)
- August (1)
- July (4)
- June (3)
- May (2)
- April (1)
- March (1)
- February (2)
- January (1)
- 2009
- 2008
- My blog
- Post new blog entry
- All blogs
Run 12 Pion AN Preview
Nov 12
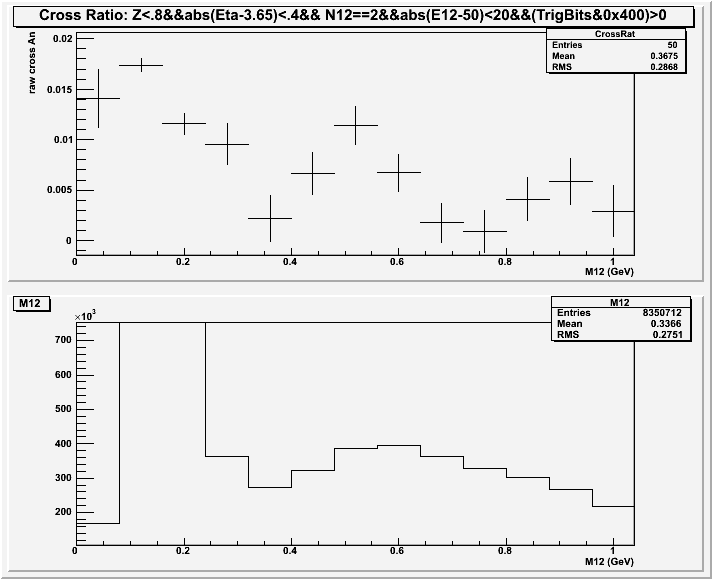
I am adding a plot for the first look at raw cross ratio vs Mass for Masses above the Pi0 with
30<E12<70
4.05>Eta>3.25.
Z<.8
This is the same data set and data selection as discussed for pi0 last week and shown below.
I am noting the narrow eta peak (eta'??) is in the AN plot. Is this telling us about large background in this region?
-------------------------------------------------------------------------------
With good Run 12 calibration based on Day 58 data, I have analyzed Days 56-62.
See PDF for details.
Groups:
- heppel's blog
- Login or register to post comments