- heppel's home page
- Posts
- 2021
- July (3)
- 2020
- February (1)
- 2019
- 2018
- 2017
- 2016
- December (2)
- November (2)
- October (3)
- September (2)
- August (1)
- July (3)
- June (5)
- May (8)
- April (4)
- March (1)
- February (2)
- January (2)
- 2015
- December (1)
- November (4)
- October (8)
- September (4)
- August (3)
- July (2)
- June (7)
- May (8)
- April (5)
- March (13)
- February (5)
- January (2)
- 2014
- December (1)
- November (2)
- September (1)
- June (3)
- May (2)
- April (1)
- March (3)
- February (2)
- January (1)
- 2013
- 2012
- 2011
- December (2)
- November (1)
- September (2)
- August (3)
- July (2)
- June (6)
- May (2)
- April (2)
- March (3)
- February (3)
- January (3)
- 2010
- December (1)
- November (2)
- September (2)
- August (1)
- July (4)
- June (3)
- May (2)
- April (1)
- March (1)
- February (2)
- January (1)
- 2009
- 2008
- My blog
- Post new blog entry
- All blogs
LedTimeDependence
Spreadsheet Summary of time dependence of LED response for all FMS cells from Run 13
I have posted a web page with data for each cell.
http://www.star.bnl.gov/protected/spin/heppelmann/LedTime/leddist.html
For each cell, I show an analysis of the time dependence of the LED ADC from day 107-140 or Run 13. The time dependence is fit to an exponential (expo) with the function
(log ADC)=par0+par1*day.
The data fields columns in the list are
NSTB-1
ROW-1
COL-1
NDOF : The number of LED points analyzed over the full period (one point ~ 40 led events)
AVE ADC: The average LED count over all points.
AVE110: The fit to data evaluated at day 110.
PAR0: fit parameter (see above)
PAR1: fit parameter (see above) not this parameter is the decay constant for signals with units day^-1.
CHI2/DOF: is the chi2 for the fit
PLOT13: this is a clickable link to a graph of the led ADC vs time for this cell as observed in Run 13
PLOT12: also clickable link to a similar graph for the led ADC vs time from run 12
GCOR: Current value of the gain correction factors based on day108 of RUN 13
For example,
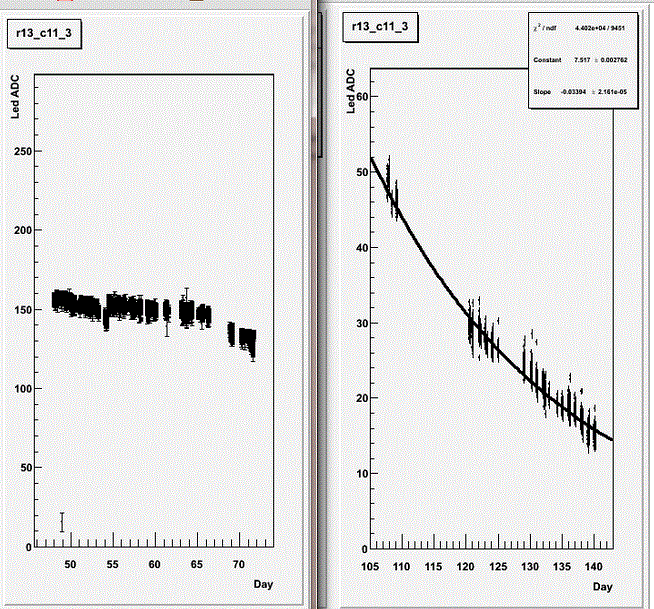
hr13_c11_3.gif is the graph of ADC vs Time(Day number) for Row 13, Col 11, Det=3 (NSTB=4)
On the Left (Figure below) we see the adc vs time for Run 12 run period (Day 50-70). On the right
we see the time dependence for Run 13 (Day 107-140).

Notice that the exponential slope for this cell is -0.0339 day^(-1). This implies a decay period of about 30 days.
Profile of Radiation Damage
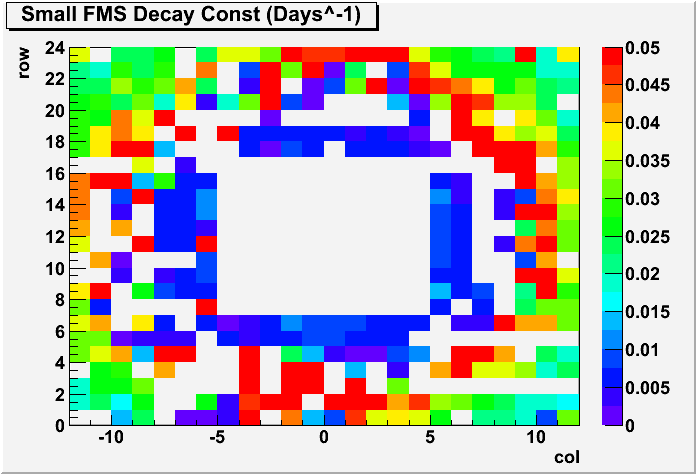
The following plot shows the fitted decay constants for each of the small cells of the FMS.
In some regions, the led signal is too small to analyze.

Note that the above pattern has greatest radiation damage about 2 or 3 cells from the central opening.
The region nearest the opening has rad hard glass.
Also, missing data from the mid rapidity region corresponds to the most damaged regions and where data could not be obtained. Cells (8+8) in rows 2 and 4 (NSTB=4) had voltage problems.
Also note that the red in this figure indicates an exponential decay time of about 20 days for radiation damage in Run 13. The rad hard cells seem to have typical decay times of about 100-200 days (for Run 13 luminosity).
Below is the same plot for large cells.
.gif)
We note again that at the pseudo-rapidity corresponding to the bread between small and large cells, the decay time for radiation damage is about 30 days and near the outer edge of the large array, the time scale for damage is about 100 days or more.
Also there is a region near one lower corner of the array where something systematic happened to cells on the detector boundary. These fits are biased by some common problem. (Row ~ 34 c Col~ 17)
- heppel's blog
- Login or register to post comments
