- heppel's home page
- Posts
- 2021
- July (3)
- 2020
- February (1)
- 2019
- 2018
- 2017
- 2016
- December (2)
- November (2)
- October (3)
- September (2)
- August (1)
- July (3)
- June (5)
- May (8)
- April (4)
- March (1)
- February (2)
- January (2)
- 2015
- December (1)
- November (4)
- October (8)
- September (4)
- August (3)
- July (2)
- June (7)
- May (8)
- April (5)
- March (13)
- February (5)
- January (2)
- 2014
- December (1)
- November (2)
- September (1)
- June (3)
- May (2)
- April (1)
- March (3)
- February (2)
- January (1)
- 2013
- 2012
- 2011
- December (2)
- November (1)
- September (2)
- August (3)
- July (2)
- June (6)
- May (2)
- April (2)
- March (3)
- February (3)
- January (3)
- 2010
- December (1)
- November (2)
- September (2)
- August (1)
- July (4)
- June (3)
- May (2)
- April (1)
- March (1)
- February (2)
- January (1)
- 2009
- 2008
- My blog
- Post new blog entry
- All blogs
FNAL new Tube study
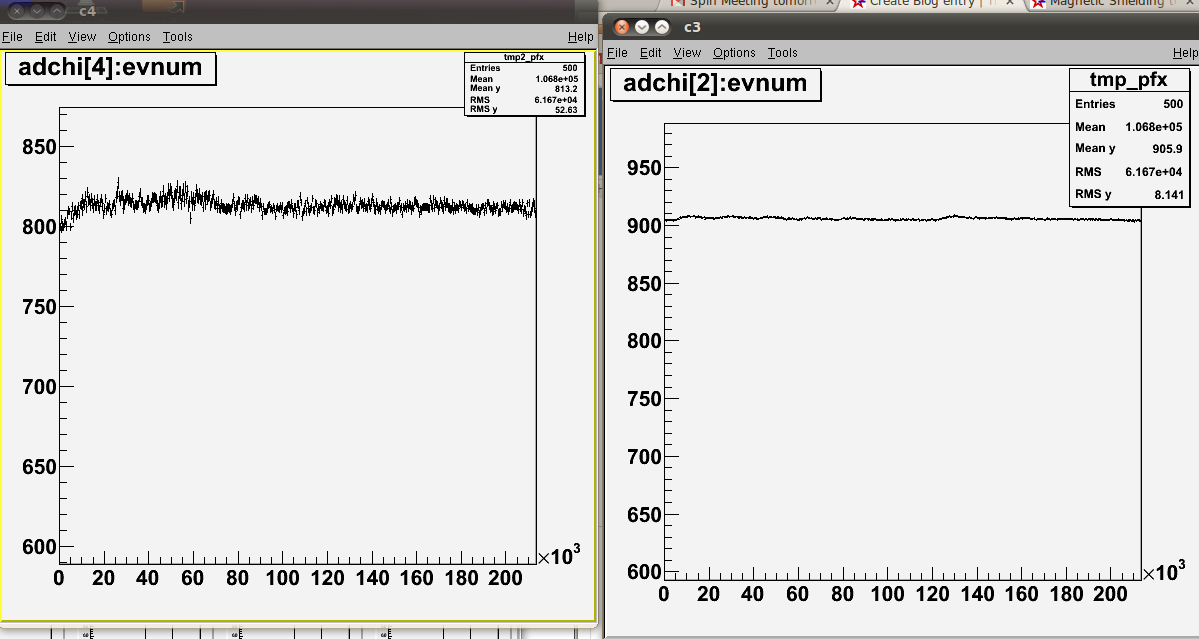
This is an early stage attempt to measure the stability of one of the new FNAL tubes.
The pulse is ~50 ns and the window of integration is about 100 ns.
The scale of the signal size is 200 fc per count with a pedistal of 600 counts.
The left figure is for a yale board, the right figure is for one of the FNAL tubes and bases.
This represents about 12 hours of date, about 250K events.
The two phototubes look at the same led and data is collected together.
Voltage of FNAL base is 1200 V
Voltage of yale base is hex 80 counts

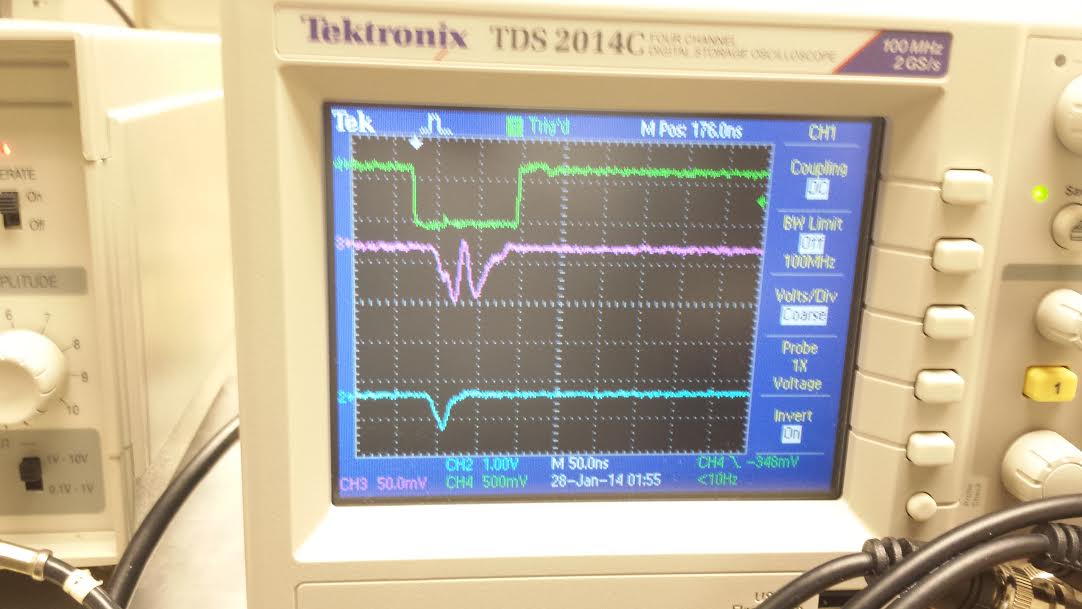
The signals are seen below,
Green gate
Magenta FNAL tube-base
Cyan Yale tube-base

Groups:
- heppel's blog
- Login or register to post comments
