- heppel's home page
- Posts
- 2021
- July (3)
- 2020
- February (1)
- 2019
- 2018
- 2017
- 2016
- December (2)
- November (2)
- October (3)
- September (2)
- August (1)
- July (3)
- June (5)
- May (8)
- April (4)
- March (1)
- February (2)
- January (2)
- 2015
- December (1)
- November (4)
- October (8)
- September (4)
- August (3)
- July (2)
- June (7)
- May (8)
- April (5)
- March (13)
- February (5)
- January (2)
- 2014
- 2009
- June (3)
- My blog
- Post new blog entry
- All blogs
AnalysisRun16066027
Updated on Tue, 2015-03-10 00:20. Originally created by heppel on 2015-03-08 03:21.
The detailed analysis of triggers for this run follows
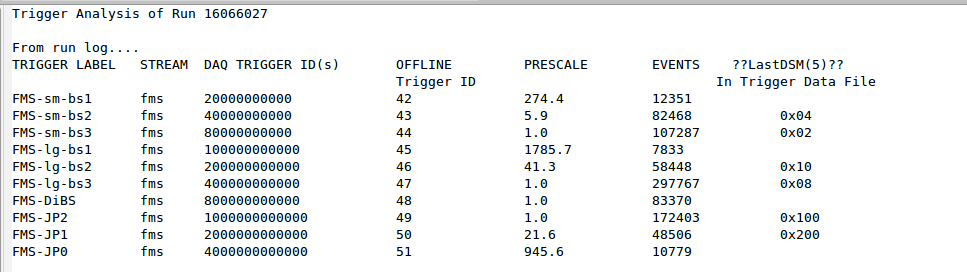
black=(Any FMS Trigger)
red= (JP2)
green= (JP1)
blue=(sm-bs3)
yellow=(sm-bs2)
magenta=(lg-bs3)
cyan=(lg-bs2)
The following plots are pretty busy. Higher resolution pdf files are linked for each of the following 3 plots.
The following plots are pretty busy. Higher resolution pdf files are linked for each of the following 3 plots.
First we look as mass plots for each of 8 pseudorapidity bins with nominal values {4.0,3.8,3.6,3.4,3.2,3.0,2.8,2.6}
The colors indicate which trigger mask bit was present
.gif)
For the same pseudorapidity bins, we show similar plots for photon pair energy for 2 photon events in the pi0 region.
Finally, again we show the same 8 pseudorapidity regions but this time plotting "Pt" for pi0 events.
----------------------------------------------------------------------------
With voltages set from the previous iteration gain corrections (except for NSTB =3) which has not yet been updated, the following plots show the energy of reconstructed pi0's vs rapidity for two trigger conditions.1
1) for reconstructed pi0 events with FMS Jet2 trigger satisfied the following is the distribution in energy and pseudorapidity.
2)For pi0 events satisfying Jet Patch 1 but not Jet Patch 2, the corresponding distribution is shown below.
»
- heppel's blog
- Login or register to post comments