- heppel's home page
- Posts
- 2021
- July (3)
- 2020
- February (1)
- 2019
- 2018
- 2017
- 2016
- December (2)
- November (2)
- October (3)
- September (2)
- August (1)
- July (3)
- June (5)
- May (8)
- April (4)
- March (1)
- February (2)
- January (2)
- 2015
- December (1)
- November (4)
- October (8)
- September (4)
- August (3)
- July (2)
- June (7)
- May (8)
- April (5)
- March (13)
- February (5)
- January (2)
- 2014
- December (1)
- November (2)
- September (1)
- June (3)
- May (2)
- April (1)
- March (3)
- February (2)
- January (1)
- 2013
- 2012
- 2011
- December (2)
- November (1)
- September (2)
- August (3)
- July (2)
- June (6)
- May (2)
- April (2)
- March (3)
- February (3)
- January (3)
- 2010
- December (1)
- November (2)
- September (2)
- August (1)
- July (4)
- June (3)
- May (2)
- April (1)
- March (1)
- February (2)
- January (1)
- 2009
- 2008
- My blog
- Post new blog entry
- All blogs
ComparisonRun12_ Run13_500
The Run 12 500 GeV data had a prescale factor of 1 and the Run 13 500 GeV data may have had a prescale factor of 10.
Assuming all prescale factors are 1, the data rate (invariant cross section without acceptance correction) is plotted for both run sets.
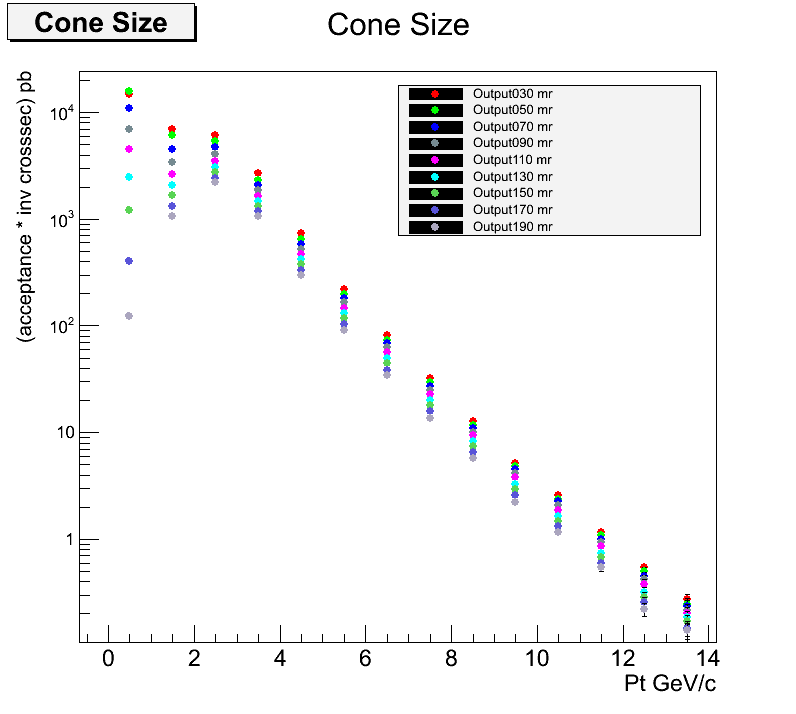
The following plot (left) shows the invariant cross section (without acceptance correction) for pp 500 GeV
Run 13 (Day 130). The run 13 data has a large section of the detector dead for part of the run and a larger acceptance correction.
The same figure from Run 12 (Day 80) is on the right.
For all plots, the pi0 were selected with loose cuts and cone sized indicated by colors.
Left Run 13 Right Run 12
(no accounting for prescale factor)
(note: If we ignore the prescale factors for Run 13 data and Run 12 data, the cross section look like the following)

.gif)
If the prescale factor of 10 is applied to the Run 13 data, the left plot increases by a factor of 10 and the right plot is unchanged.
- heppel's blog
- Login or register to post comments
