- heppel's home page
- Posts
- 2021
- July (3)
- 2020
- February (1)
- 2019
- 2018
- 2017
- 2016
- December (2)
- November (2)
- October (3)
- September (2)
- August (1)
- July (3)
- June (5)
- May (8)
- April (4)
- March (1)
- February (2)
- January (2)
- 2015
- December (1)
- November (4)
- October (8)
- September (4)
- August (3)
- July (2)
- June (7)
- May (8)
- April (5)
- March (13)
- February (5)
- January (2)
- 2014
- 2009
- June (3)
- My blog
- Post new blog entry
- All blogs
FMS calibration in Heavy Ion Collisions
Updated on Fri, 2016-04-29 11:29. Originally created by heppel on 2016-04-28 10:02.
I have made progress on analysing heavy ion collision data for calibration.
The chain of programs that I use for calibration has been modified to solve various problems related to high multiplicity. We still do not have enough calibration data to do a calibration however.
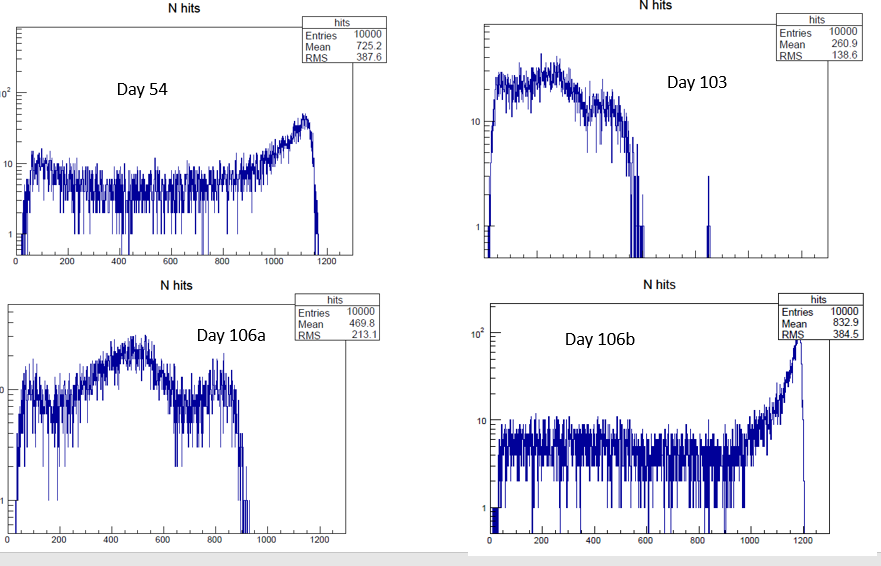
I have looked at data for 4 runs, under different trigger conditions. Plots attached below.
The analysis below is based on our standard analysis chain. Events with more than 300 ADC valuse above threshold are not analzed. Events that have more than 1 TeV of energy are tagged as likly LED events and are also not analyzed.
1) Day 54 (min bias)
2) Day 103 (dedicated run with first trigger setup)
3) Day 106a (dedicated run with second trigger setup)
4) Day 106b (run with highly prescaled FMS trigger)
The # hits distributions for 10000 trigger samples are shown below.
Each pdf below corresponds to 3 pages of figures for these data sets and for events that pass the inital high multiplicity pre selection.
The figures shown are
page1:
1)Total number of cells (>1 ADC counts)
2)Distribution of number of clusters
3)Energy deposited
4)Energy of cluster vs. Cluster Index (energy ordered)
page2:
1)Pt distribution for high energy cluster
2)Pt distribution for second highese energy cluster
3)Pt distribution for all other clusters 3-...
4)For 2 photon clusters, 2 photon energy vs. pseudorapidity of first cluster
page3: All plots cut on <10 clusters
1)For 2 photon clusters, 2 photon energy vs. pseudorapidity of first cluster
2)For 2 photon clusters, 2 photon mass vs. pseudorapidity of first cluster
3) Best Selected mass distribution in large cell region
4) Best Selected mass distribution in small cell region
»
- heppel's blog
- Login or register to post comments