- heppel's home page
- Posts
- 2021
- July (3)
- 2020
- February (1)
- 2019
- 2018
- 2017
- 2016
- December (2)
- November (2)
- October (3)
- September (2)
- August (1)
- July (3)
- June (5)
- May (8)
- April (4)
- March (1)
- February (2)
- January (2)
- 2015
- December (1)
- November (4)
- October (8)
- September (4)
- August (3)
- July (2)
- June (7)
- May (8)
- April (5)
- March (13)
- February (5)
- January (2)
- 2014
- 2009
- June (3)
- My blog
- Post new blog entry
- All blogs
Iteration0
I am starting the analysis data with iteration 0 voltages (but with 1 crate of Lecroy supplies for Large South removed)
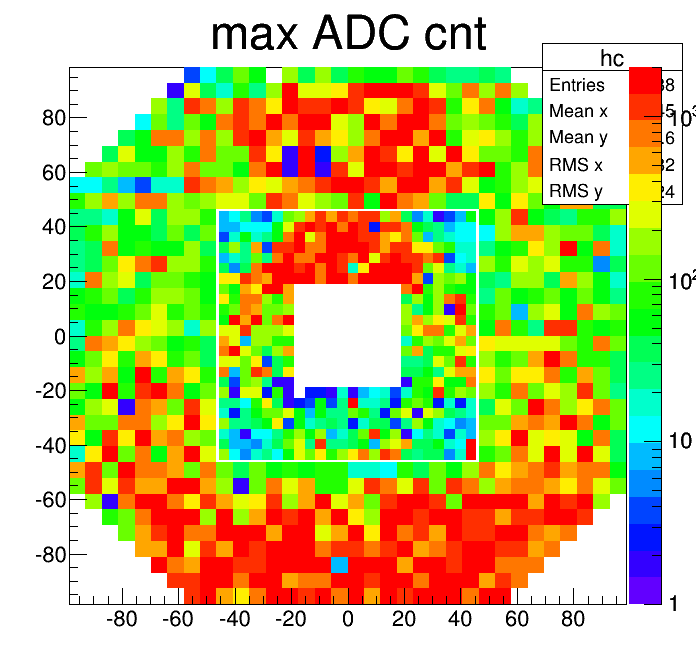
For comparison, I plot the maximum adc count observed in each channel before and after the voltage change.
Before iteration0 voltage change

After iteration0 voltage change and before analysis with iteration0 voltages. The blue regions reflect the Lecroy power supply that is off.
This is from Run 16053025.
.gif)
------------------------------------------------------------------------------------
Using gain corrections from about 8 hours of processing, I analyzed the run 16053025 data to look for pi0's. The 7 mass plots at different pseudorapidities are obtained with the following cuts.
.gif)
-----------------------------------------------------------------
After another 10 hours of mass fitting we are ready to change voltages again.
For this full cycle of mass fitting, the mass distributions for 7 eta bins as described above are now:
.gif)
here is link to HTML page
The FMS Correction file http://www.personal.psu.edu/hfa/160/FromRun15/16053025/FMS/gifs/FmsCorr.txt_V11
- heppel's blog
- Login or register to post comments
