- heppel's home page
- Posts
- 2021
- July (3)
- 2020
- February (1)
- 2019
- 2018
- 2017
- 2016
- December (2)
- November (2)
- October (3)
- September (2)
- August (1)
- July (3)
- June (5)
- May (8)
- April (4)
- March (1)
- February (2)
- January (2)
- 2015
- December (1)
- November (4)
- October (8)
- September (4)
- August (3)
- July (2)
- June (7)
- May (8)
- April (5)
- March (13)
- February (5)
- January (2)
- 2014
- 2009
- June (3)
- My blog
- Post new blog entry
- All blogs
Mass Plots after voltage change
Updated on Fri, 2016-05-13 22:42. Originally created by heppel on 2016-05-13 18:53.
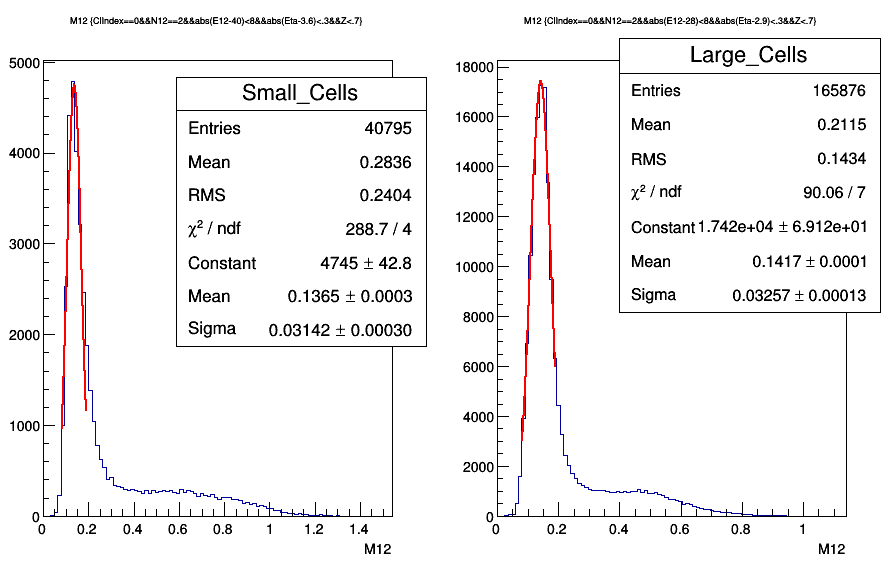
The following figure shows mass plots from Runs 17133066 and 17133067. These are the two runs after Chris changed voltage.
The calibration is currently nominal ("all ones" for gain corrections). The plots are cut with
1) Two Photons (in the highest energy .060 radian cone)
2) Z<.7
3) for left figure (3.3<pseudo-rapitity<3.9) and for right figure (2.6<pseudo-rapidity<3.2)
4) two photon energy left: (32 GeV<E12<48 GeV) right: (20<E12<38)
The above peaks are selected below and sorted by each FMS trigger
.png)
The pion pT dependence for each of these triggers is shown below for regions of Eta (pseudo-rapidity)
.gif)
This plot is also attached below with better resolution.
»
- heppel's blog
- Login or register to post comments