- heppel's home page
- Posts
- 2021
- July (3)
- 2020
- February (1)
- 2019
- 2018
- 2017
- 2016
- December (2)
- November (2)
- October (3)
- September (2)
- August (1)
- July (3)
- June (5)
- May (8)
- April (4)
- March (1)
- February (2)
- January (2)
- 2015
- December (1)
- November (4)
- October (8)
- September (4)
- August (3)
- July (2)
- June (7)
- May (8)
- April (5)
- March (13)
- February (5)
- January (2)
- 2014
- December (1)
- November (2)
- September (1)
- June (3)
- May (2)
- April (1)
- March (3)
- February (2)
- January (1)
- 2013
- 2012
- 2011
- December (2)
- November (1)
- September (2)
- August (3)
- July (2)
- June (6)
- May (2)
- April (2)
- March (3)
- February (3)
- January (3)
- 2010
- December (1)
- November (2)
- September (2)
- August (1)
- July (4)
- June (3)
- May (2)
- April (1)
- March (1)
- February (2)
- January (1)
- 2009
- 2008
- My blog
- Post new blog entry
- All blogs
ProjectionsForPI0inclusive50invPb_ALL
Here is a figure showing errors projected for a 50 pb^(-1) measurement of double spin asymmetry. The measurement is based on loose pi0 cuts (necessary for large pt) and on error=1/Sqrt[N]/Pol/Pol with N the number of events in a bin. This result uses a 35 mR cone for two photon selection, with a minimal suppression of signal from the exclusive cut.
The trigger from run 12 was FMS Jet Patch 2. It is this that defines the lower pT response and can be set to anything we choose. In Run 12 we used a Jet Patch 1 with prescaling to sample the distribution to lower pt (~ 1 GeV lower). The pseudo-rapidy range is the full range of the FMS 2.7<Y<4.
The data used was Day 60 from Run 12 with integrated luminosity of about 0.31 pb^(-1) and these result are scaled up from that to 50 pb^(-1).
(This is incomplete)
The error plot above is based on the number of events per pb^(-1). Those numbers are plotted below.
The following plot shows the number of pi0 events per 1 Gev bins per inverse pB of luminosity.
This is something with units (d sigma)/(dpT) or cross section per GeV/c.
Luminosities were taken from http://www.star.bnl.gov/protected/common/triggerPages.html (Run 12 Day 60)
The values used were:
=============================================================================================================================
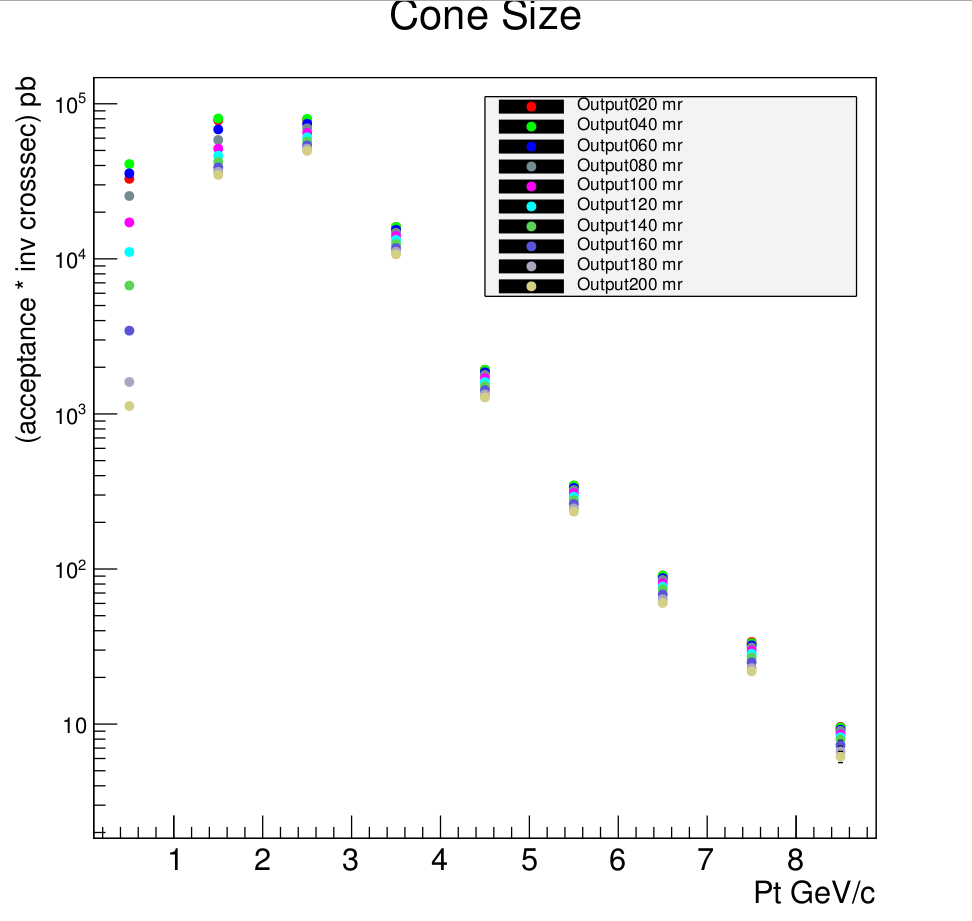
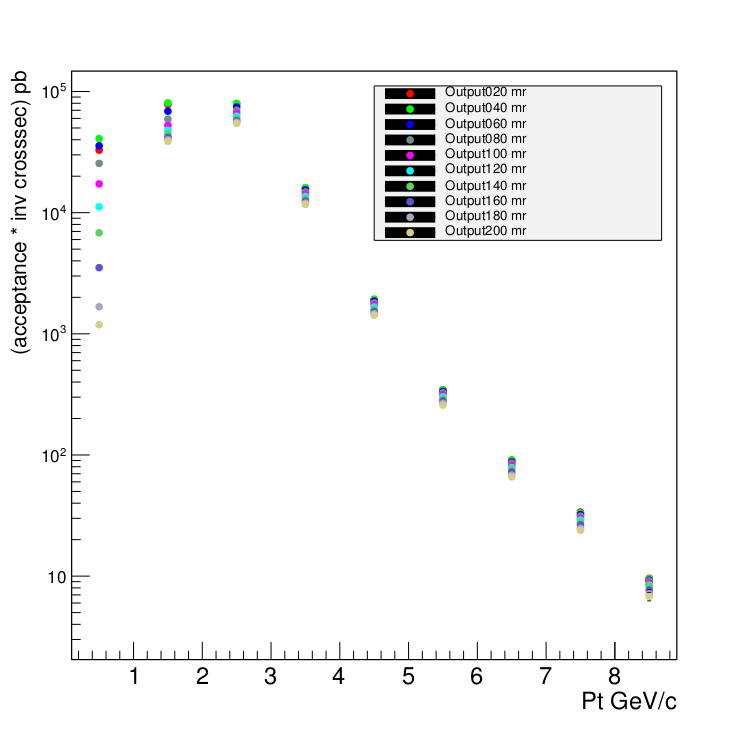
Sam Heppelmann's analysis of cone size dependence of Invariant Cross Section without acceptance correction.
The following plot is with soft energy within the specified cone size required to be small.

The following ploit is the same without cone size cut.

- heppel's blog
- Login or register to post comments
