- heppel's home page
- Posts
- 2021
- July (3)
- 2020
- February (1)
- 2019
- 2018
- 2017
- 2016
- December (2)
- November (2)
- October (3)
- September (2)
- August (1)
- July (3)
- June (5)
- May (8)
- April (4)
- March (1)
- February (2)
- January (2)
- 2015
- December (1)
- November (4)
- October (8)
- September (4)
- August (3)
- July (2)
- June (7)
- May (8)
- April (5)
- March (13)
- February (5)
- January (2)
- 2014
- 2009
- June (3)
- My blog
- Post new blog entry
- All blogs
Run15 Callibration Step 0
I have been working for several weeks to improve my code and get it working well for calibration of new 100 GeV data.
A callibration cycle takes assumed gain goals for each cell (here the Et weighted gain goals from run 12) a starting set of gain corrections those numbers (initially set to all ones).
Callibration involves two main tracks.
1) ADC distributions (Plots 2 in html file) are converted to energy distributions based on current gain numbers. Clustering is done and plots are made of both the high cell energy distribution (of the cluster) and the single cluster distribution (cluster centered on the cell in question). The cluster energy distribution is fitted to a functional form. The value of the fitted function at energy 3 GeV is plotted. A horizontal black line is added to the plots showing the 3 GeV level. (this is Plots 1 in my html file) This track of analysis is good to bring the gains in line with neighbor cells.
2) The pi0 peak is plotted for events with high photon energy in the cell in question. This track is used to define the correct absolute levels for gain corrections.
In either track, the adjustment is made to gain corrections to 1) make smooth function of pseudorapidity; 2) reset mass peak to pi0 mass.
Run 16041062 Tuesday was a min bias run (trigger not yet available). I ran 4 cycles of track 1) of callibration the resulting distribution is posted.
---------------------------------------------------------------------------------------------
Sunday Feb 15...
Much more work has been done with run 16041062, including finding pi0's in this minimum bias data.
The link to the html for the improved calibation is here
Run16041062
The correction values used to obtain the above html file is linked below
These corrections are to be compared with an "all one" set of corrections. This is then the input needed to determine the voltages.
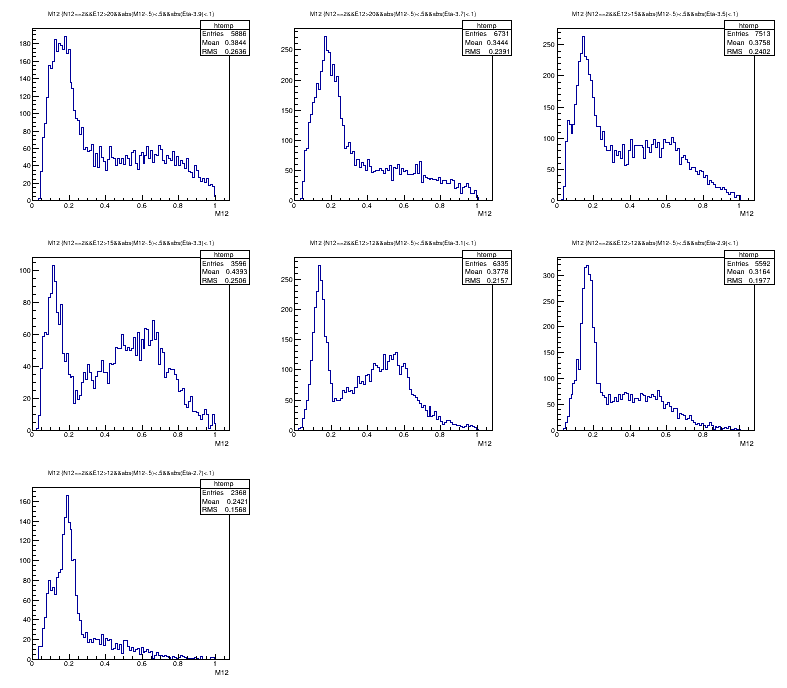
These corrections have been adjusted to give pi0 masses in the approximately correct range. Pi0 mass distributions below are shown for
7 pseudorapidity bins {3.9, 3.7, 3.5, 3.3, 3.1, 2.9, 2.7}. These are lower energy pi0's than we usually use for callibration.

----------------------------------------------------------------------------------------------------
Tues Feb 17...
More more work has been done with run 16041062.
I now have run the pi0 fitting code so the mass plots can be observed on the HTML page.
The correction values used to obtain the new (tuesday) html file is linked below
These corrections again are to be compared with an "all one" set of corrections. This is then the input needed to determine the voltages.
The differences from the sunday post above are
- some influence from pi0 mass (not much because there are too few at high enough energy).
- Cells with max adc < 10 counts are taken as off and are assigned gaincorr=5
- Cells have gaincor capped at gaincorr=20
HTML for tuesday Feb 17 analysis is 16041062
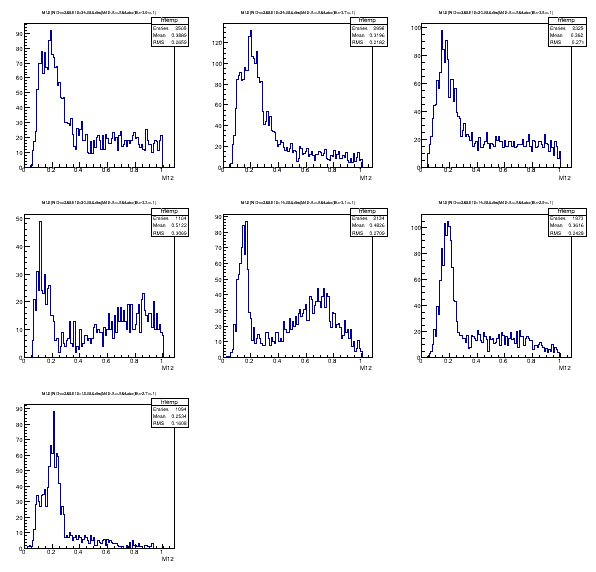
These corrections have been adjusted to give pi0 masses in the approximately correct range. Pi0 mass distributions below are shown for
7 pseudorapidity bins {3.9, 3.7, 3.5, 3.3, 3.1, 2.9, 2.7}. These are lower energy pi0's than we usually use for callibration. I have raised the energy limit in each pseudorapidity bin as compared to the sunday analysis above. See caption for cuts.

- heppel's blog
- Login or register to post comments
