- heppel's home page
- Posts
- 2021
- July (3)
- 2020
- February (1)
- 2019
- 2018
- 2017
- 2016
- December (2)
- November (2)
- October (3)
- September (2)
- August (1)
- July (3)
- June (5)
- May (8)
- April (4)
- March (1)
- February (2)
- January (2)
- 2015
- December (1)
- November (4)
- October (8)
- September (4)
- August (3)
- July (2)
- June (7)
- May (8)
- April (5)
- March (13)
- February (5)
- January (2)
- 2014
- 2009
- June (3)
- My blog
- Post new blog entry
- All blogs
Time Dependence of FMS gains
Updated on Mon, 2015-04-13 17:12. Originally created by heppel on 2015-04-12 21:24.
Brandon has looked at led pulse size vs. time .
drupal.star.bnl.gov/STAR/blog/bsumma/look-radiation-damage-fms
The radiation damage is similar to what Stephen has seen.
In this note, I will look at 3 approaches to tracking time dependence of FMS gains. The question again is about the effects of radiation of FMS performance.
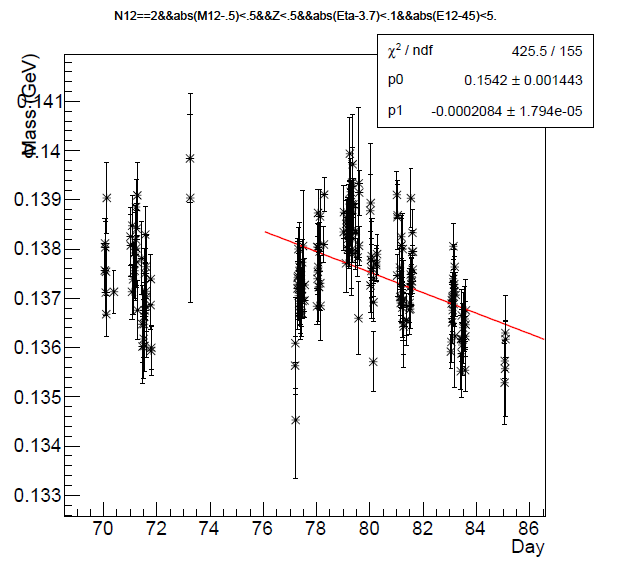
First we look at the time dependence of pi0 masses in the region
- energy range 40 GeV<E<50 GeV
- pseudo-rapidity 3.6<Eta<3.8 GeV (small cells)
- Z<.5
- 2 Photons in 100 mR cone (Pi0 mass .05<M<.35 Gev)
The data from Day 70 to Day 85 (about 200 runs) are here. From the last page of that PDF file, the dependence of pi0 mass on day number is shown below. The days after day 77 are fit to a straight line. The slope suggests a change in pi0 mass of about 0.2% per day. This is in contrast to small cell gains from LED singlas that change by about 1% per day.
---------------------------------------------------------------------------------------------------------
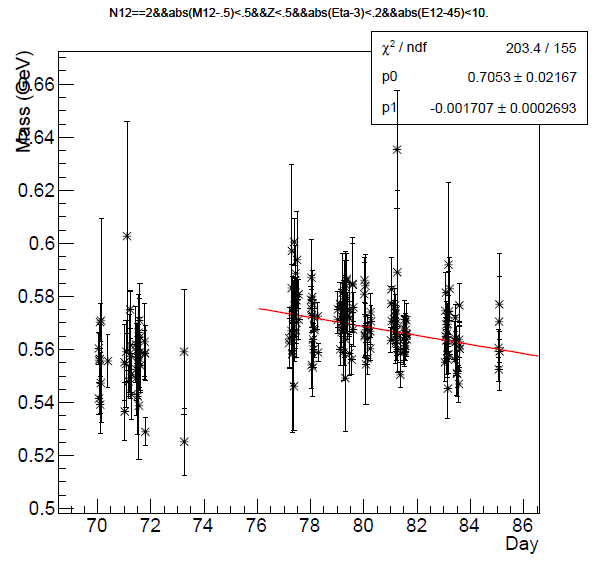
In this energy range, the pi0 reconstruction is complicated by the small separation relative to large cell sizes. Instead for the large cells, we look at the time dependence of the eta masses.
This data is shown here. We see that the change in eta mass is about 0.3% per day. In the region defined by:
- energy range 40 GeV<E<50 GeV
- Z<.5
- pseudo-rapidity 2.8<Eta<3.2 GeV (large cells)
- 2 Photons in 100 mR cone (Eta mass 0.4<M<0.70 Gev)
----------------------------------------------------------------------------------------------
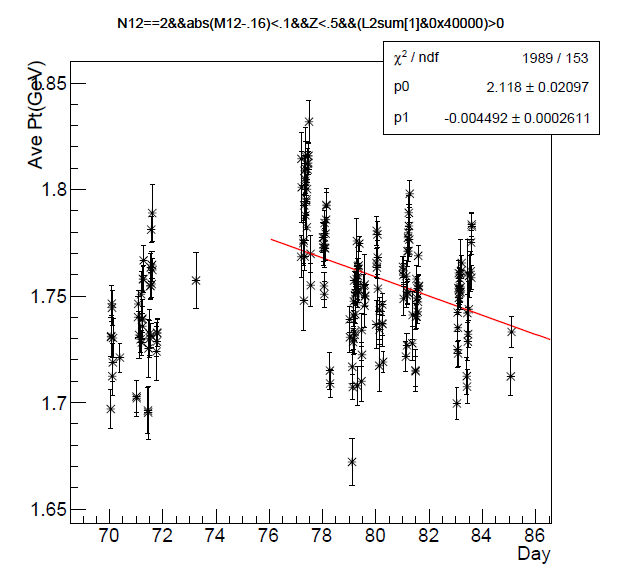
The next analysis looks for differences in the average transverse momentum passing a particular trigger (FMS Jet 0) as a function of time. The pt plots are here and defined by the following cuts:
- 2 photons in 100 mR cone, mass .06<M<0.26 GeV
- Z<.5
- FMS Jet Patch 0 L2 Trigger
This analysis involves a pt distribution for each of ~200 runs. The distributions are fit to exponential forms for pt above the trigger threshold. The last two plots in this pdf file are
- The average PT for each of ~200 runs vs Day
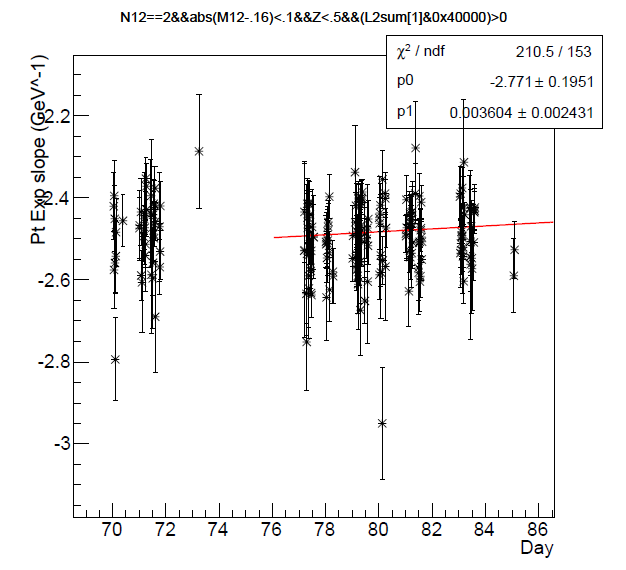
- The fitted exponential slope for each of ~200 runs vs. Day
The <Pt> vs. Day distribution is shown below. It is far from clear that this dependence is related to a monatomic change from radiation damage but if we do the fit, the average pt changes by .2% per day.
The following plot shown how the exponential fitted slope depends upon time. The time dependence of the exponential slope is seen to be consistent with zero.
»
- heppel's blog
- Login or register to post comments