Light Nucleus v1 and v2 from 3 GeV
Title: Light nucleus v1 and v2 from 3 GeV Au+Au Collisions
Target Journal : Physics Letters B
Analysis note : drupal.star.bnl.gov/STAR/blog/hexh/analysis-note-light-nucleus-flow-3-gev
Paper proposal : drupal.star.bnl.gov/STAR/system/files/hexh_LightNucleusFlow_20201021_PaperProposal.pdf
codes on RCF: /star/u/hexh/psn0770
In high-energy heavy-ion collisions, partonic collectivity was observed via the quark-scaling of the identified hadrons. In this paper, we present
ameasurement of the first- and second-order azimuthal anisotropy, v1 and v2, of light nuclei (d, t, 3He, 4He) produced in √(s_NN )=3 GeV Au+Au
collisions from the STAR experiment at the Relativistic Heavy Ion Collider (RHIC). The number of atomic-number scaling in light nucleus v1 is observed.
Unlike in much higher energy collisions, the values of v2 mid-rapidity are found to be negative for all of the light nuclei suggesting the out-of-plane
expansion. The observed phenomena will be discussed within the framework of coalescence ansatz.
Light nucleus flow measurements provide information to understand their production mechanism in heavy-ion collisions as well as the system evolution.
•Heavy nuclei v1 slope has stronger energy dependence
•Atomic mass number (A) scaling of light nuclei v2(pT) for 7.7-200 GeV
At 3 GeV Au+Au collisions, the flow pattern is affected by the spectator nucleons.
.png)
Fig. 1. (a) The <dE/dx> of charged tracks versus rigidity in Au + Au collisions at √(s_NN ) = 3 GeV. The curves are Bichsel predictions for the
corresponding particle species. (b) Particle m2/q2 versus rigidity at √(s_NN ) = 3 GeV.
.jpg)
Fig2. pT vs rapidity distribution of d, t 3He, and 4He. The bands in the distributions are caused by the momentum dependent requirements of the PID. The boxes represent the selected phase space for flow calculation.
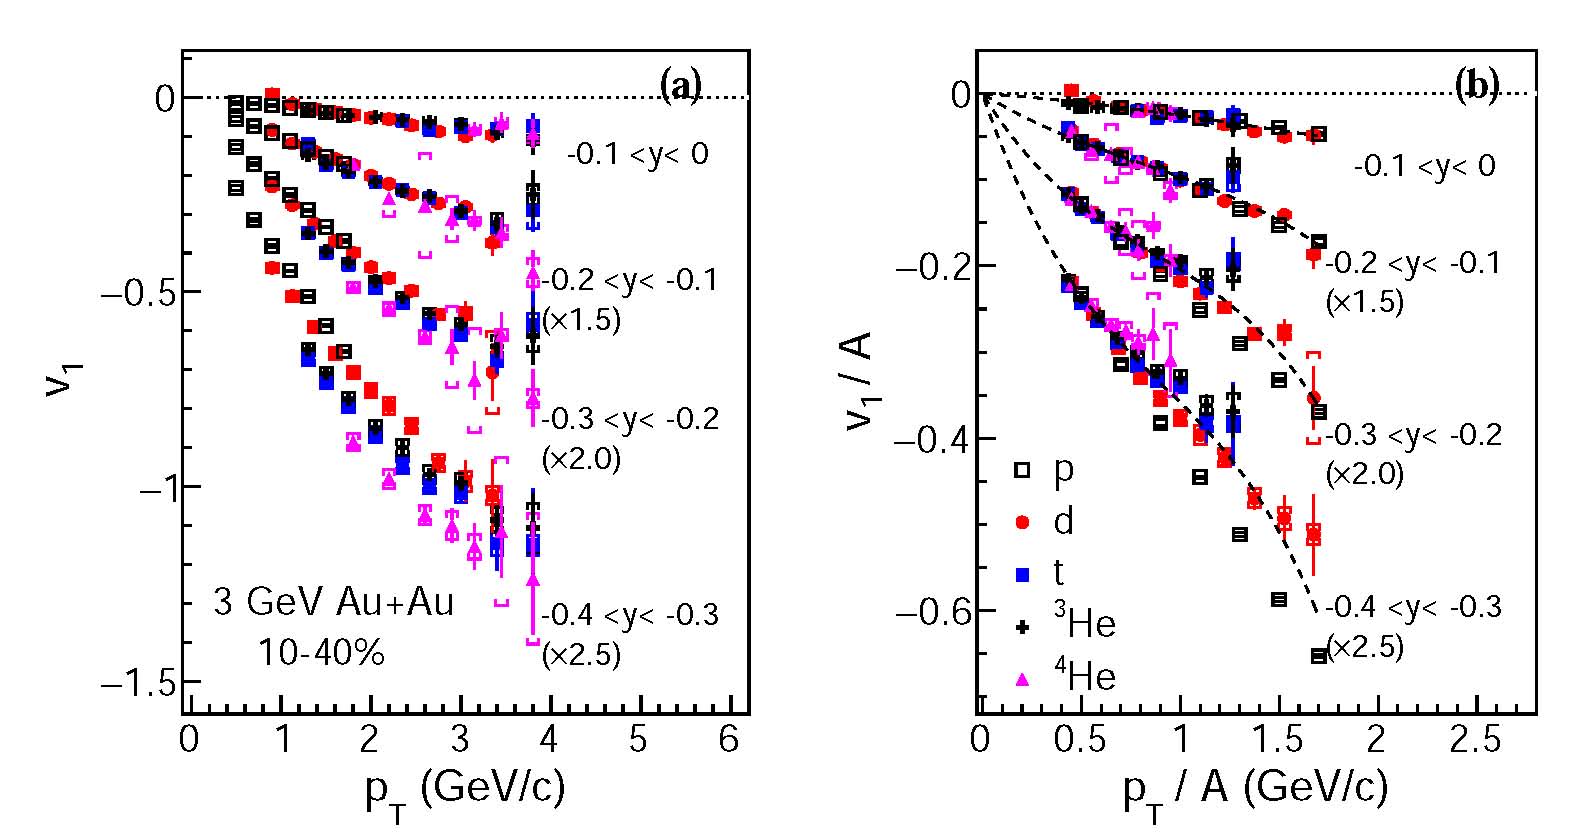
Fig.3 (a)v1 as function of pT and (b) atomic-mass-number scaled v1 as function of the scaled pT in various rapidity bins in 10-40% Au+Au collisions.
The data points for different rapidities are scaled for clarity. The dashed lines represent the fits to data points .
Statistical and systematic uncertainties are represented by vertical lines and open boxes.
.jpg)
Fig4. Upper panels: The elliptic flow v2 as function of the pT in various rapidity bins in 10-40% Au+Au collisions. Statistical and systematic
uncertainties are represented by vertical lines and open boxes. Lower panels: The same results as upper panels but both v2 and pT are scaled by A.
The dashed lines are the expected v2 for deuteron considering the proton v_1^2.
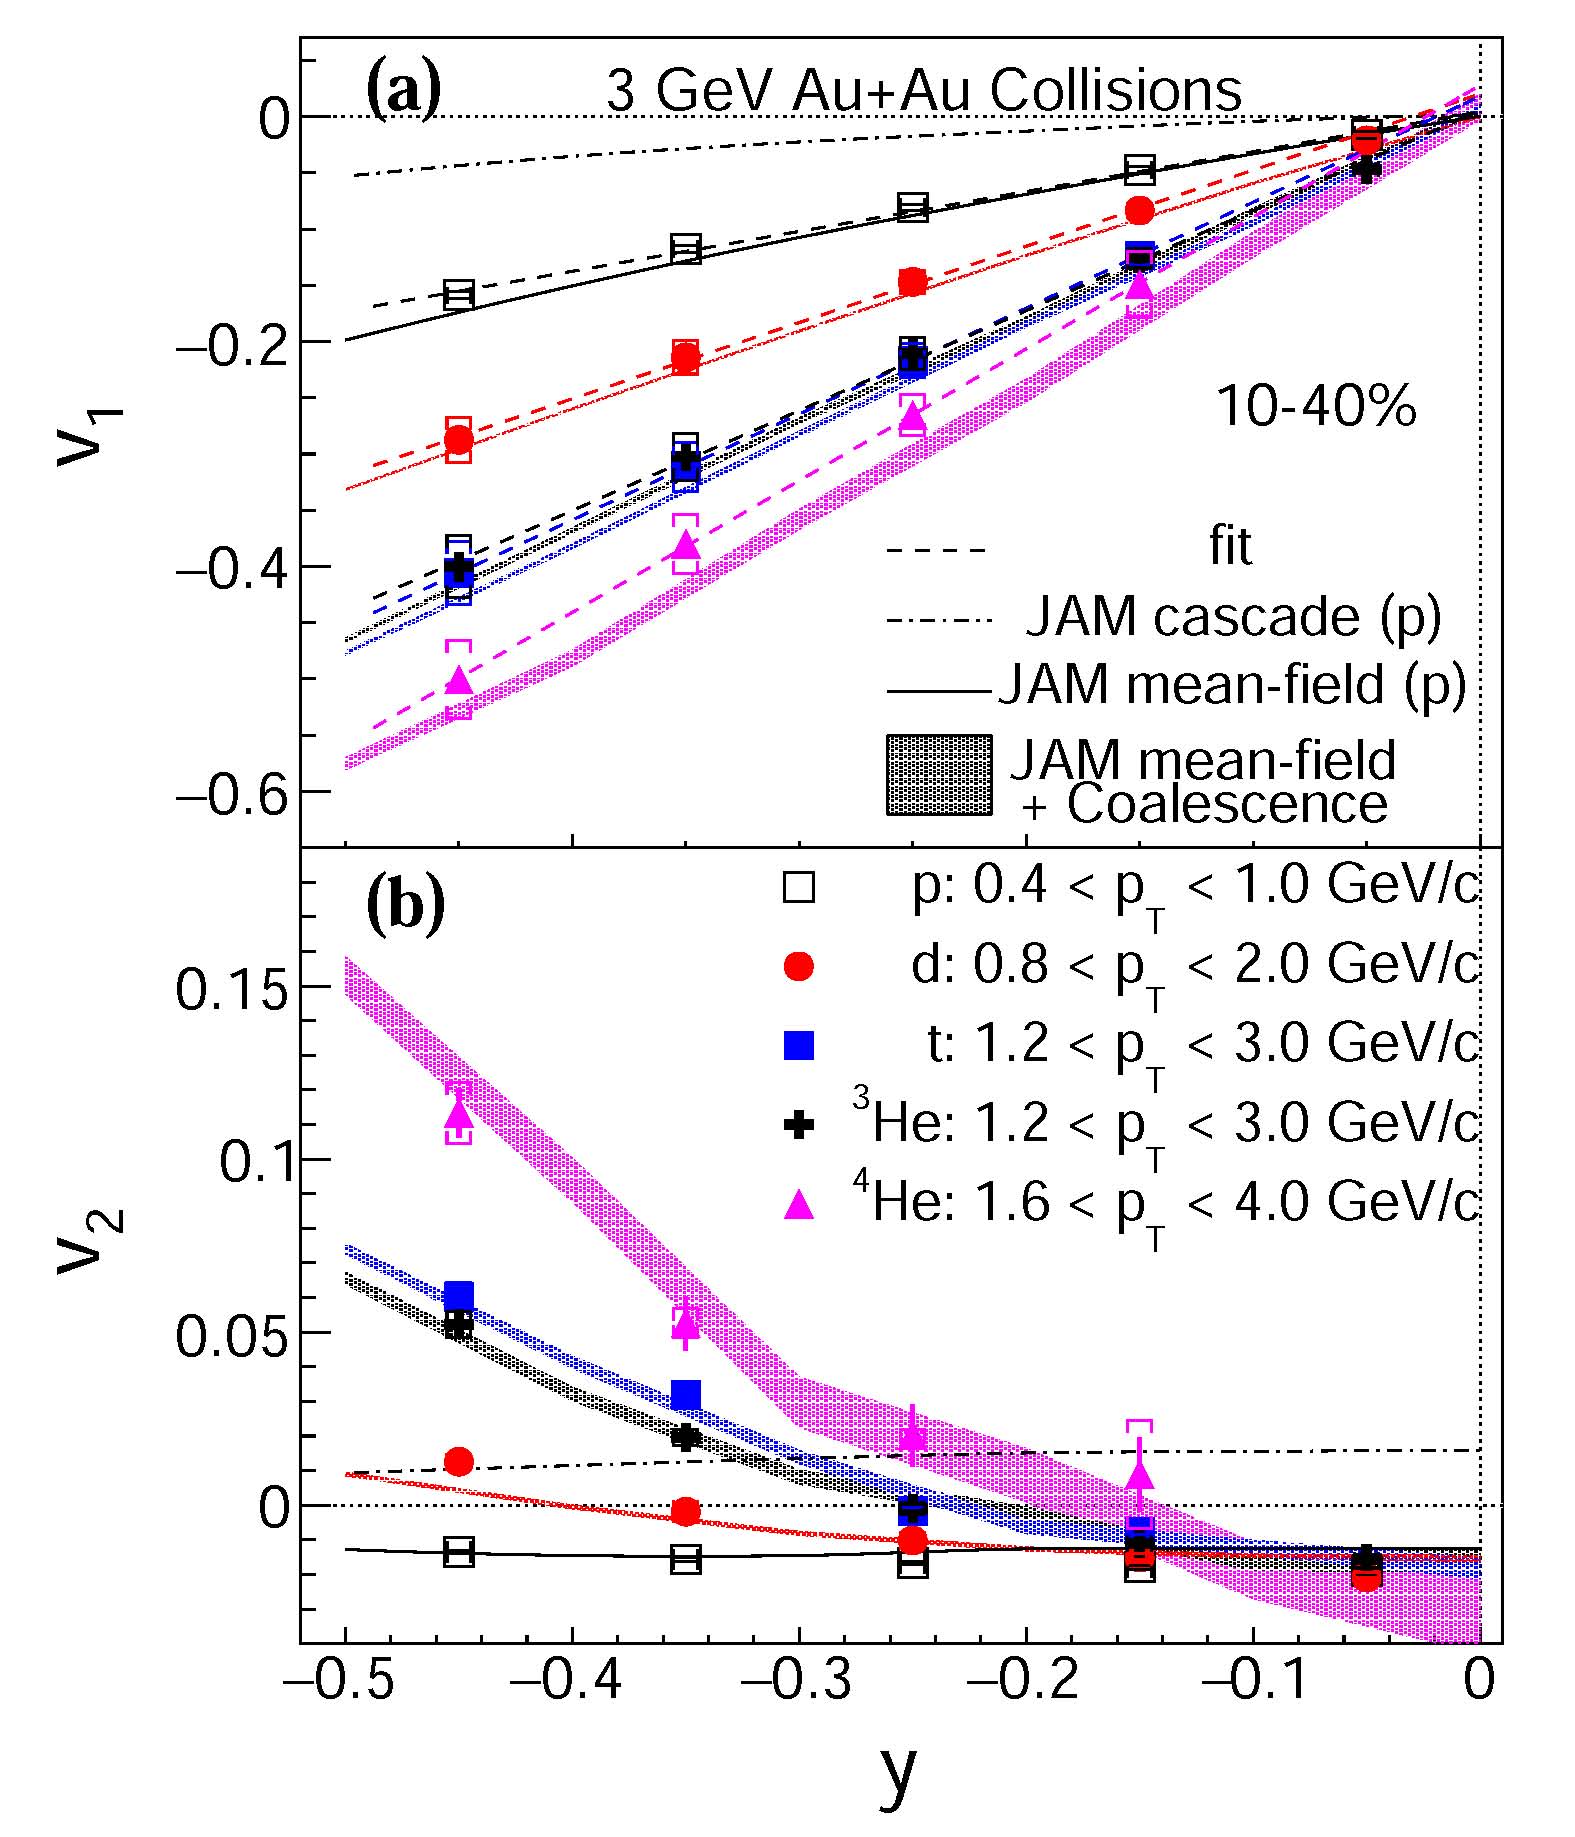
Fig. 5. (a) Rapidity dependence of light nucleus v1 in 10-40% Au+Au collisions at √(s_NN ) = 3 GeV. The dashed lines are the fits to the v1 at
midrapidity discussed in the text.
(b) Rapidity dependence of light nucleus v2 for the centralities 10-40%. Systematic uncertainties are represented by open boxes.
The data points of protons (open squares) are the results.
The dash-dotted line and solid line represent the results for proton from the cascade and mean-field modes of JAM respectively. The bands are the results for light nuclei from JAM mean-field plus coalescence calculations. Systematic uncertainties are represented by open boxes.
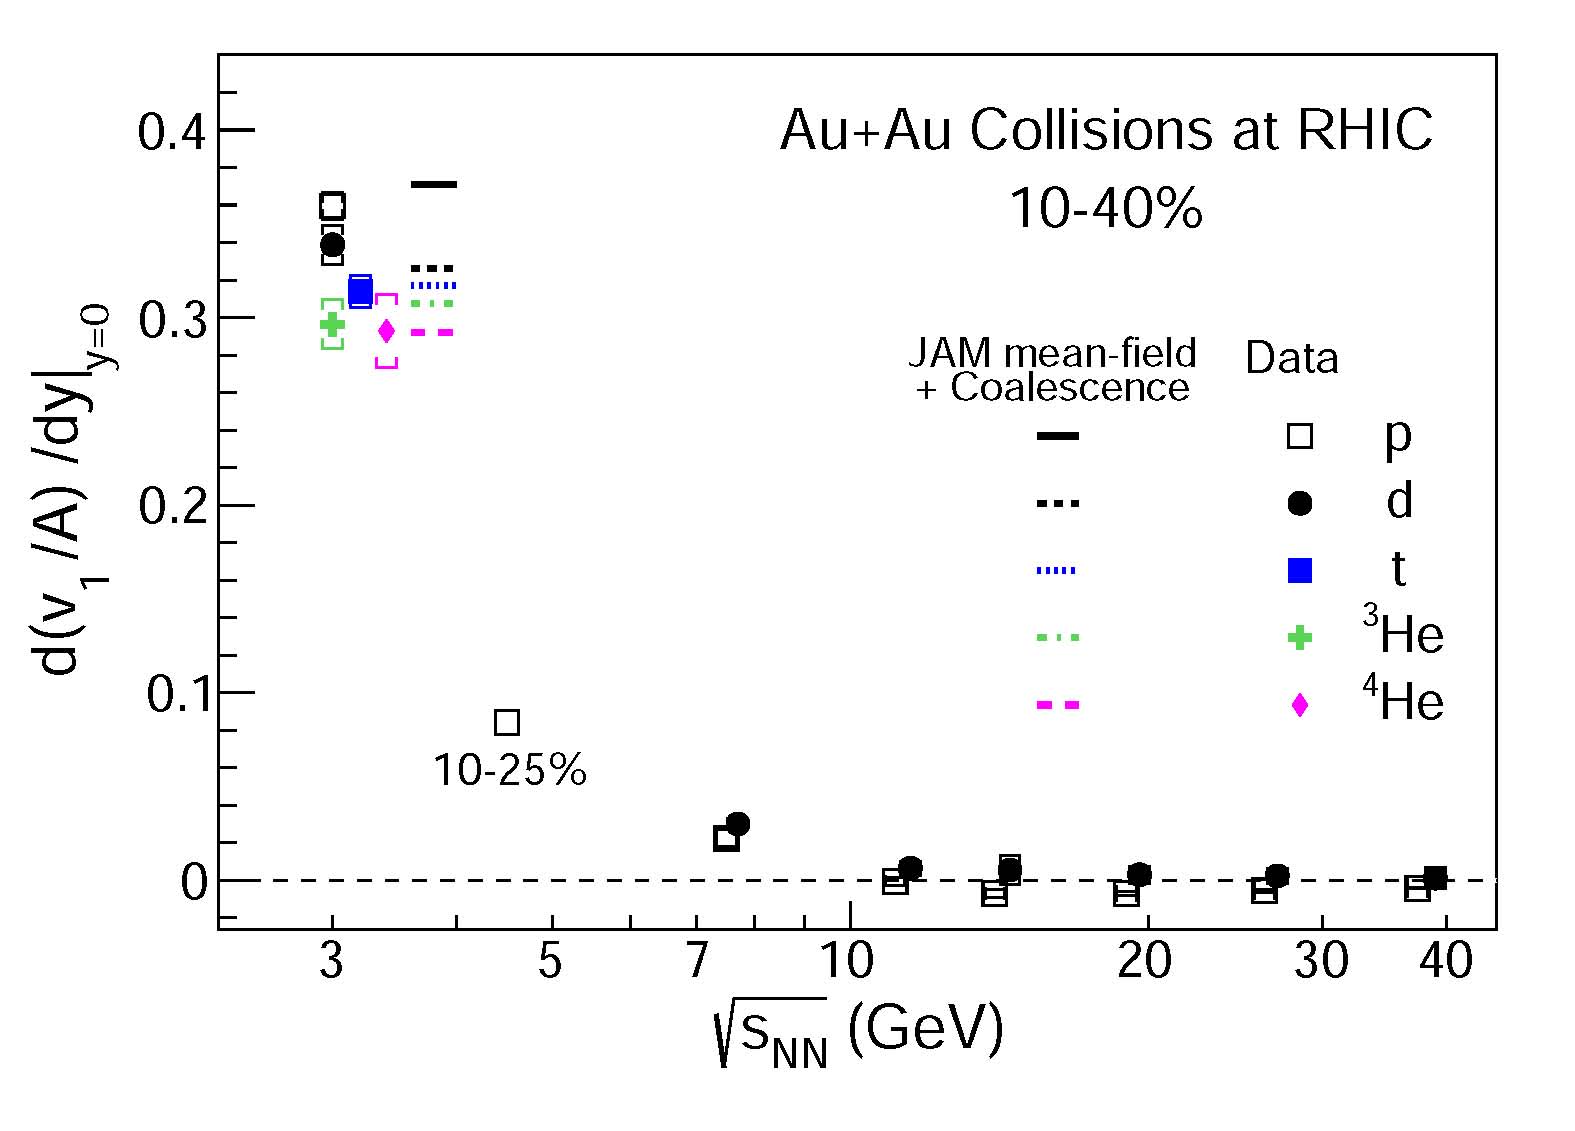
Fig. 6. Atomic-mass-number scaled v1 slope at midrapidity as a function of beam energy in 10-40% Au+Au collisions. Statistical and systematic
uncertainties are represented by vertical lines and open boxes. The data points above 3 GeV are the published results described in the text.
The data points are staggered horizontally.
Summary
The directed, v1, and elliptic flow, v2, are measured for d, t, 3He, and 4He at negative particle rapidity from Au+Au collisions at 3 GeV.
The flow coefficients are calculated relative to the first-order event-plane.
At midrapidity, the light nucleus v1(y) slope and v1(pT) follows the atomic-mass-number scaling, as expected in the simplest coalescence scenario.
The v2 value at midrapidity is negative for all light nuclei, and change to positive with decreasing particle rapidity.
There no clear mass hierarchy at midrapidity. While the heavier nuclei v2 has stronger rapidity dependence.
The atomic-mass-number scaling fails to describe the v2 significantly.
Supporting materials
proton v1 (Shaowei) : drupal.star.bnl.gov/STAR/system/files/DNP2020_Shaowei.pdf
presentations in PWG
drupal.star.bnl.gov/STAR/system/files/hexh_LightNucleusFlow_202000708_BulkCorrPWGMeeting.pdf
drupal.star.bnl.gov/STAR/system/files/hexh_LightNucleusFlow_20200812_BulkCorrPWGMeeting.pdf
drupal.star.bnl.gov/STAR/system/files/hexh_LightNucleusFlow_20200909_BulkCorrPWGMeeting.pdf
drupal.star.bnl.gov/STAR/system/files/hexh_LightNucleusFlow_20201230.pdf
Questions and comments raised in PWG
1. How about the scaling behavior for the mean pt distribution in the selected pt range?
A: In the selected pt range for light nuclei flow calculation, the mean pt do not have strong
rapidity dependence, after scaled by the atomic-mass-number, the light mean pt have similar
scaling behvior as the light nuclei v1.
More details are in drupal.star.bnl.gov/STAR/system/files/hexh_LightNucleusFlow_20201230.pdf.
2. Light nuclei production at 3 GeV
A: There is also a measurement on the light nuclei production at 3 GeV. The spectra, dN/dy, and
mean pT distributions can be found at
drupal.star.bnl.gov/STAR/system/files/light_nuclei_production_at_FXT_3GeV%28SL20d%29.pdf
drupal.star.bnl.gov/STAR/system/files/1214light_nuclei_production_at_FXT_3GeV%28SL20d%29_0.pdf
drupal.star.bnl.gov/STAR/system/files/210104light_nuclei_production_at_FXT_3GeV_SL20d.pdf
- hexh's blog
- Login or register to post comments