Webpage:Light Nuclei Production in Au+Au Collisions at 3 GeV from STAR experiment
Title: Measurement of Proton and Light Nuclei Production in Au+Au Collisions at √sNN = 3 GeV by RHIC-STAR
PAs: Daniel Cebra, Xin Dong, Benjamin Kimelman, Hui Liu, Xiaofeng Luo, Junlin Wu, Guannan Xie, Nu Xu, Ning Yu, Dingwei Zhang
Target Journal: Physical Review C
Paper draft: In preparation
Analysis Note: In preparation
Paper proposal: https://drupal.star.bnl.gov/STAR/system/files/PaperProposal_LightNucleiProduction_3GeV_HuiLiu.pdf
Abstract:
Light nuclei production is expected to be sensitive to baryon density fluctuations and can be used to probe the signatures of QCD critical point and/or first order phase transition in heavy-ion collisions. In this paper, we will present the protons (p) and light nuclei (d, t, 3He, 4He) productions in Au+Au collisions at √sNN = 3 GeV measured in 2018 by STAR experiment under Fixed-target mode. We will show the transverse momentum spectra (pT) of proton (p), deuteron (d), triton (t), 3He and 4He at various rapidity slices. The rapidity and centrality dependence of coalescence parameters B2(d), B3(t) and B3(3He), particle ratios (d/p, t/p, t/d, 3He/p and 4He/p), and yield ratios of Np*Nt/Nd2, N4He*Np/(N3He*Nd) and N4He*Nt*Np2/(N3He*Nd3) will be also presented. Their physics implications will be discussed.
Figure 1:

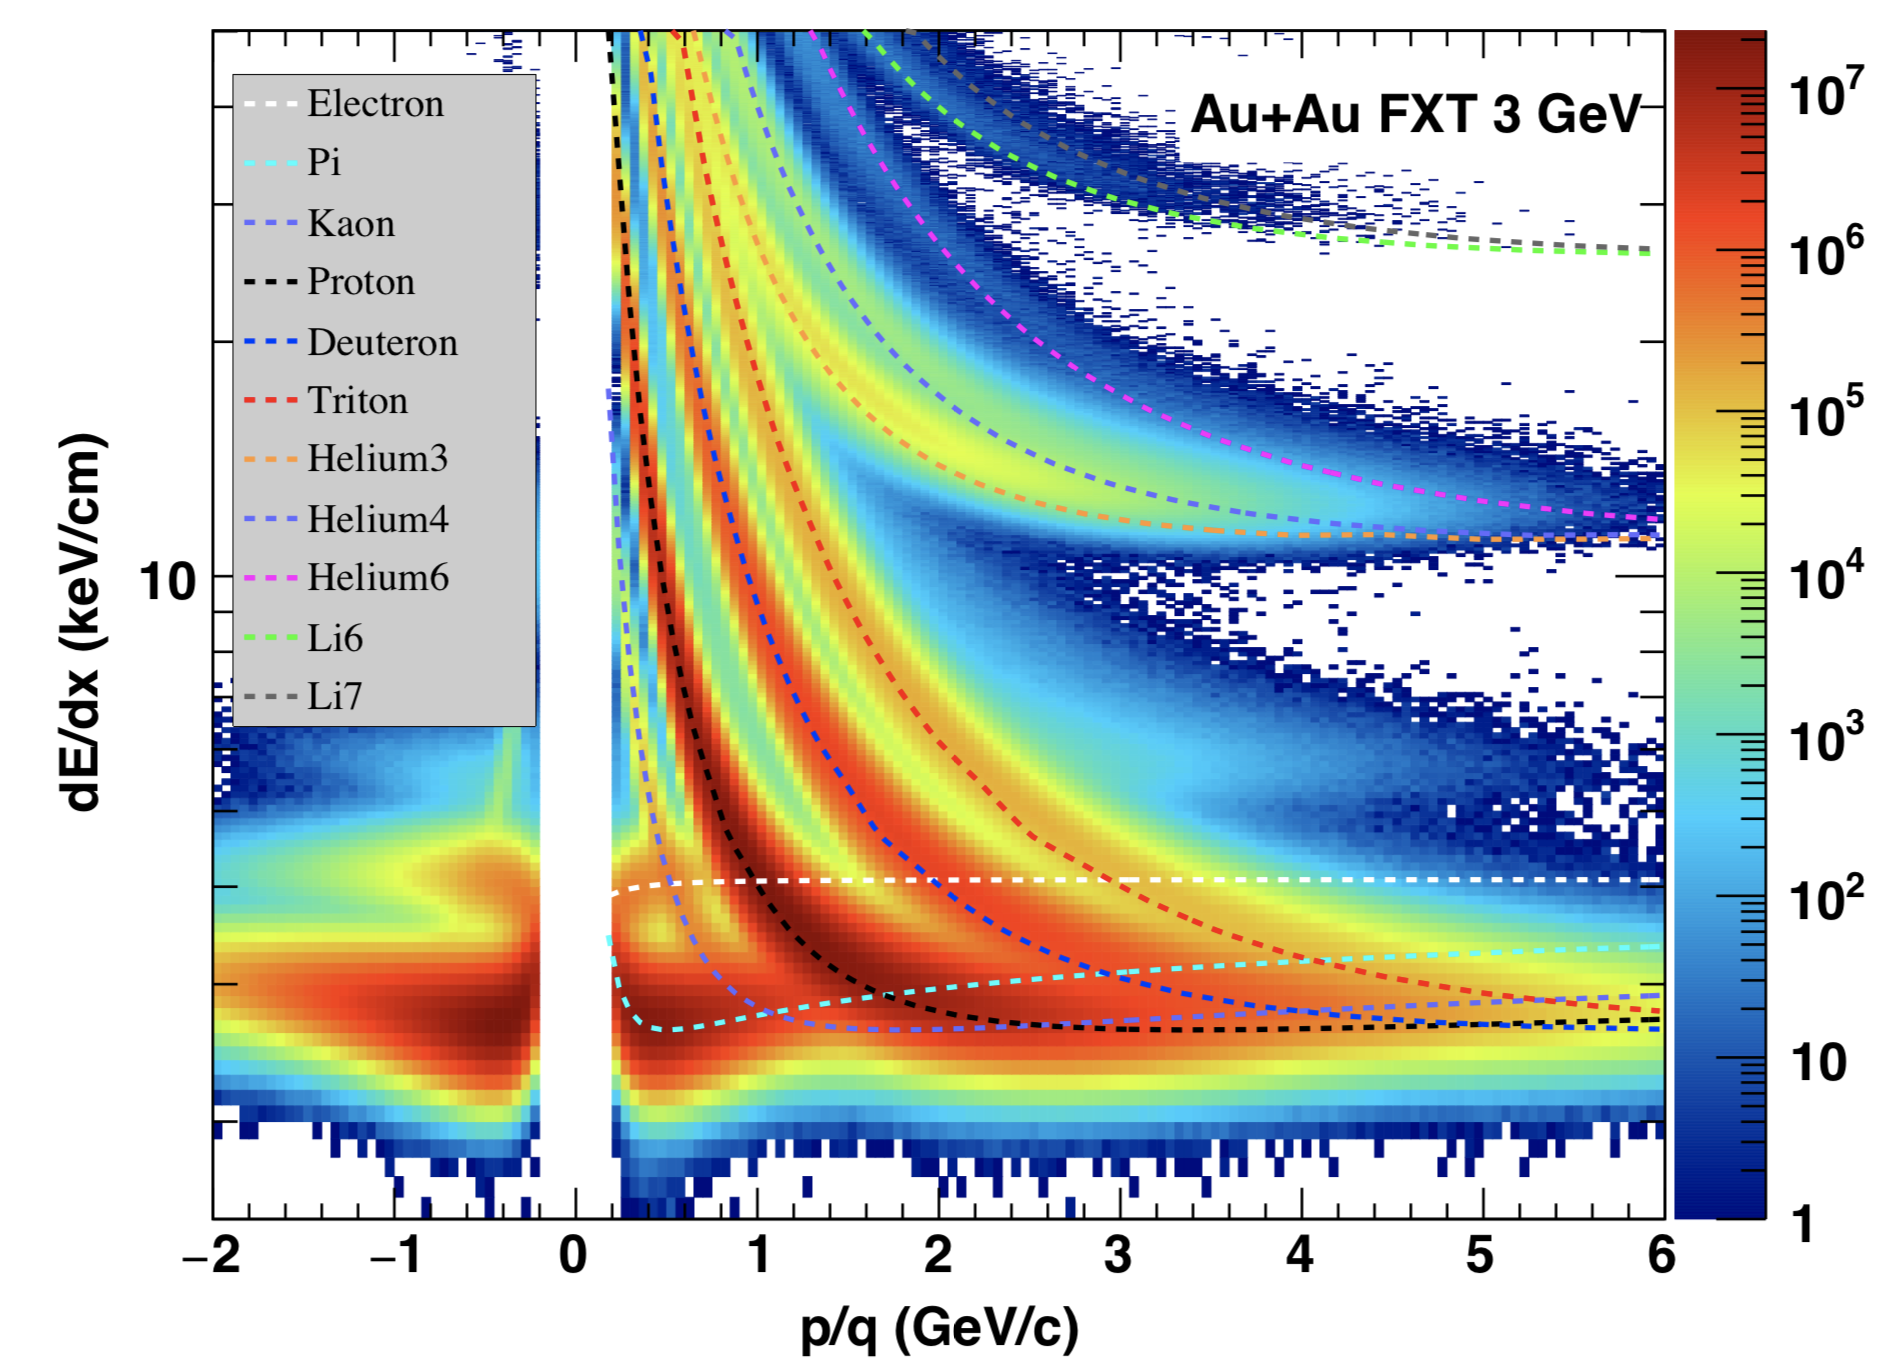
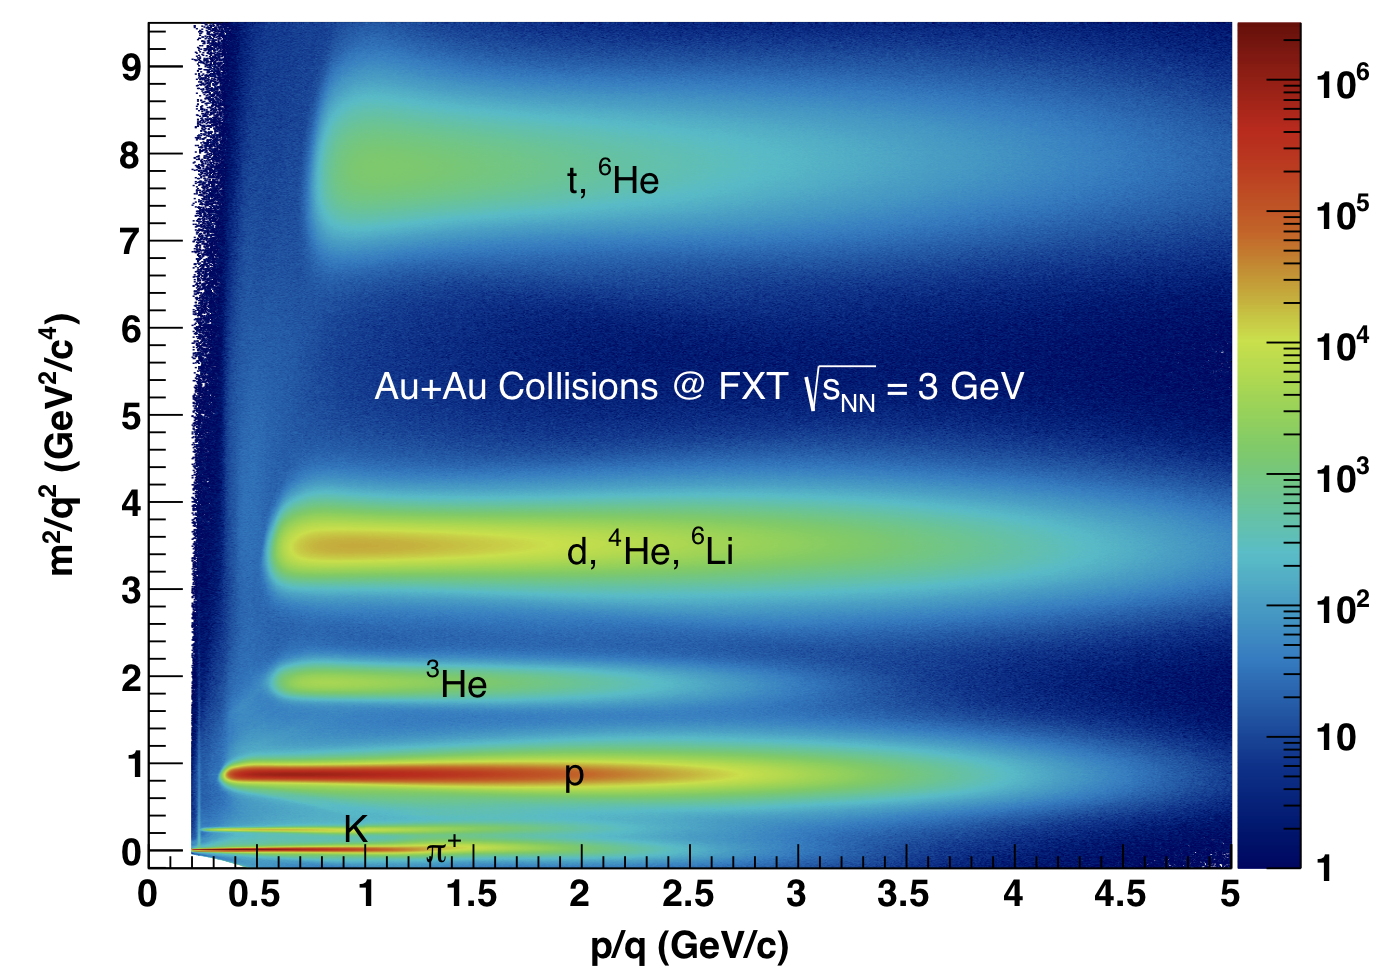
Fig. 1. (left) The <dE/dx> of charged tracks versus rigidity in Au+Au collisions at √sNN = 3 GeV. The dotted lines are Bichsel theoretical curves for the corresponding particles. (right) The m2/q2 of particle versus rigidity distribution at √sNN = 3 GeV.
Figure 2:
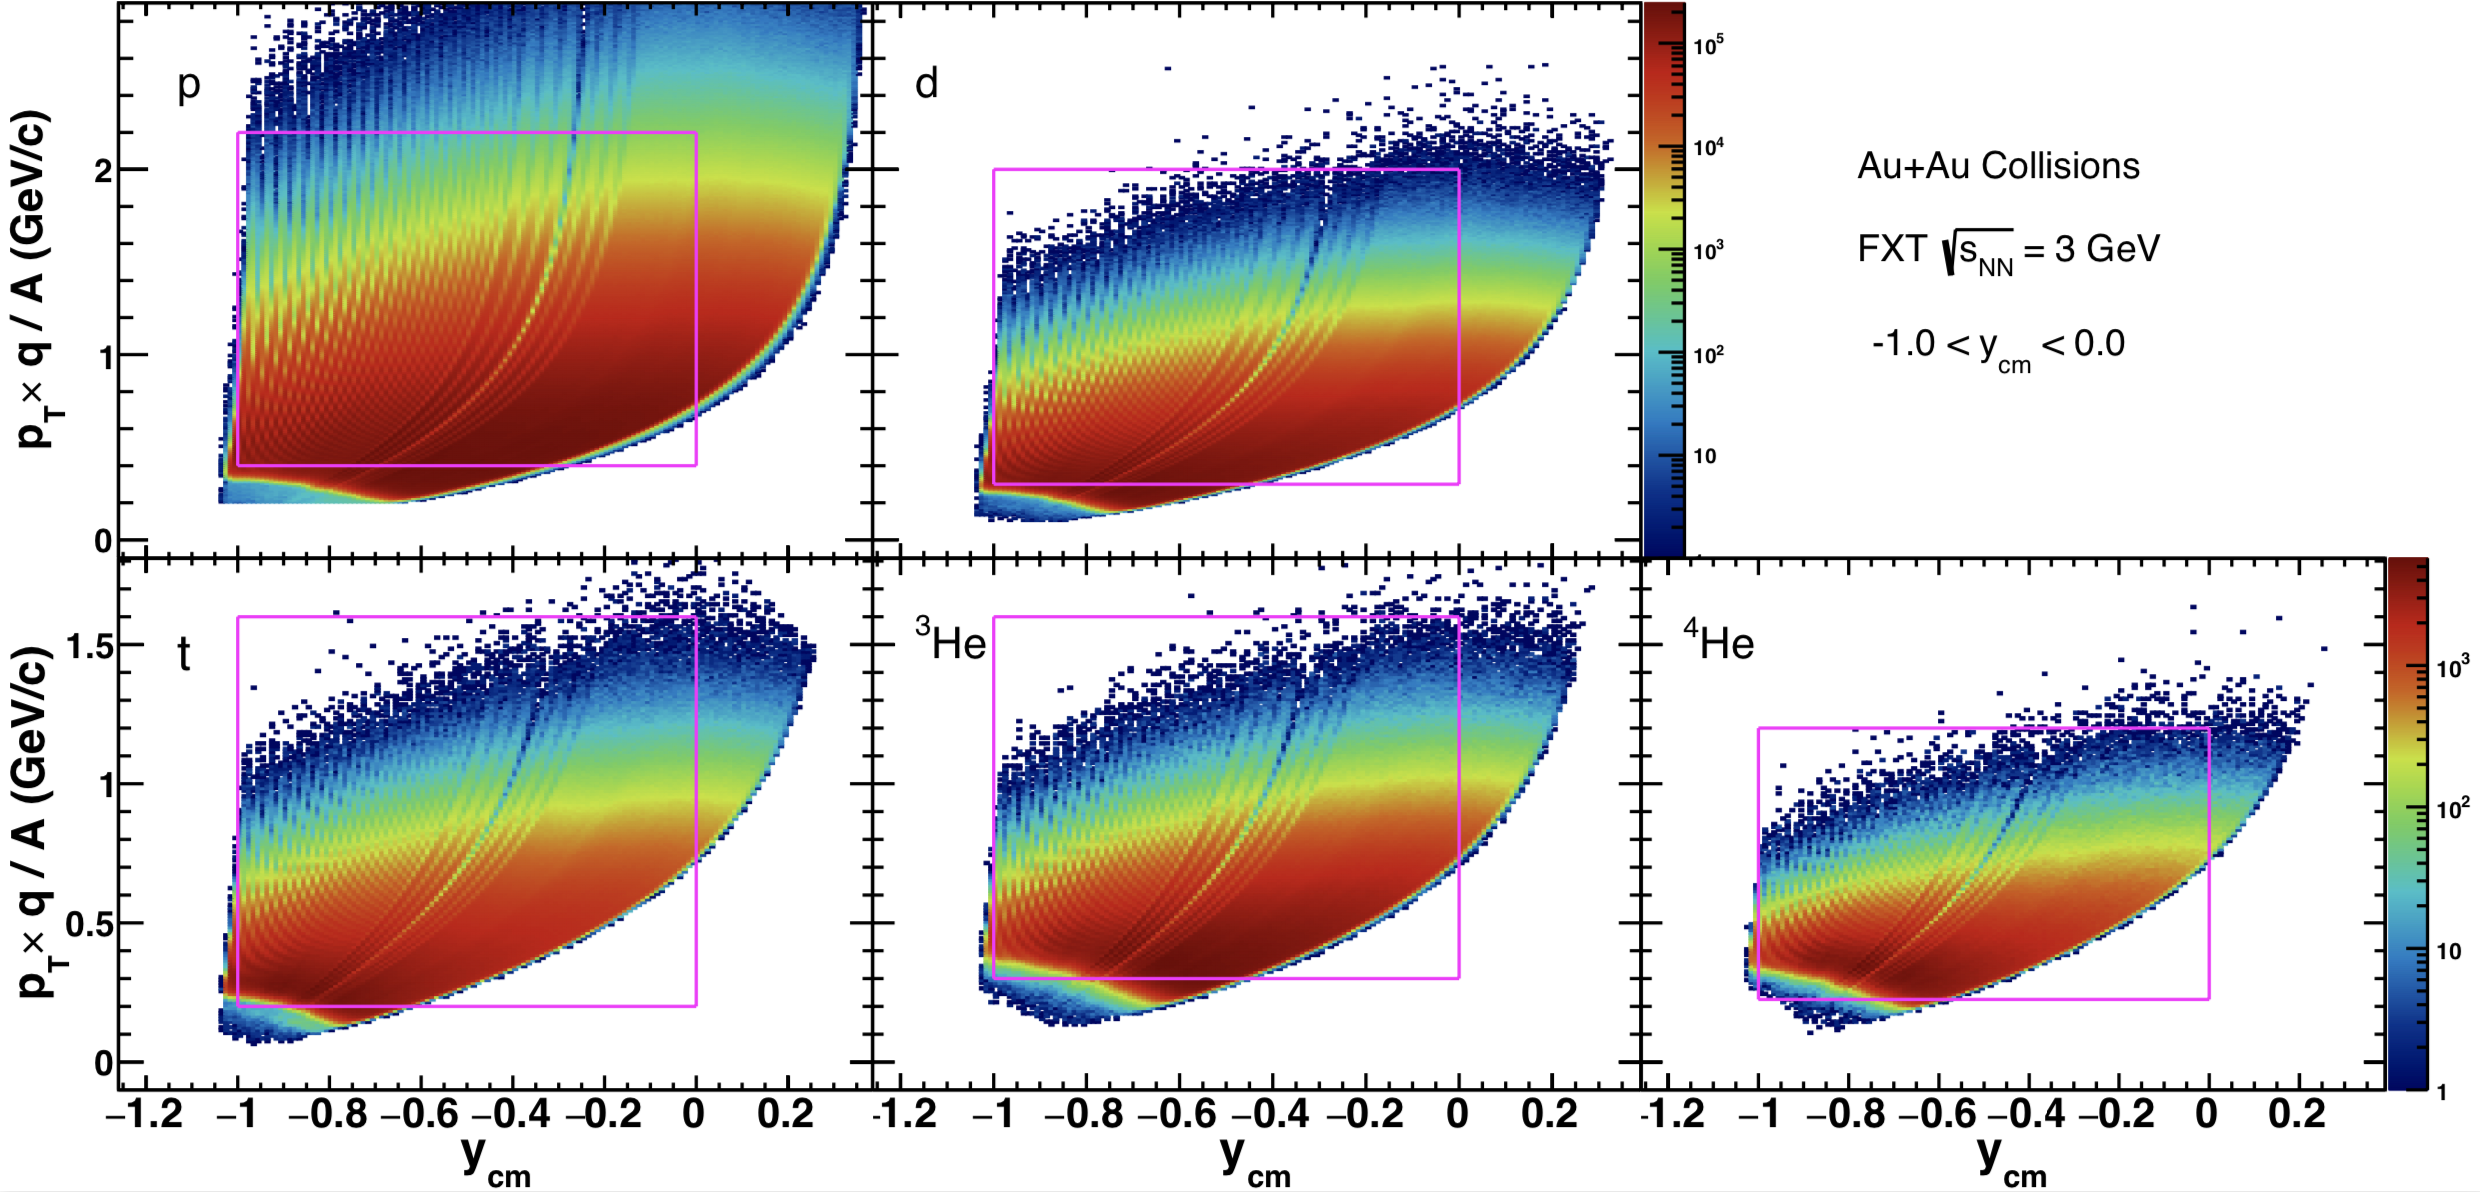
Fig. 2. Transverse momentum versus rapidity of particles in Au+Au collisions at √sNN = 3 GeV. The purple boxes indicate the pT and rapidity ranges of each particle in the analysis.
Figure 3:
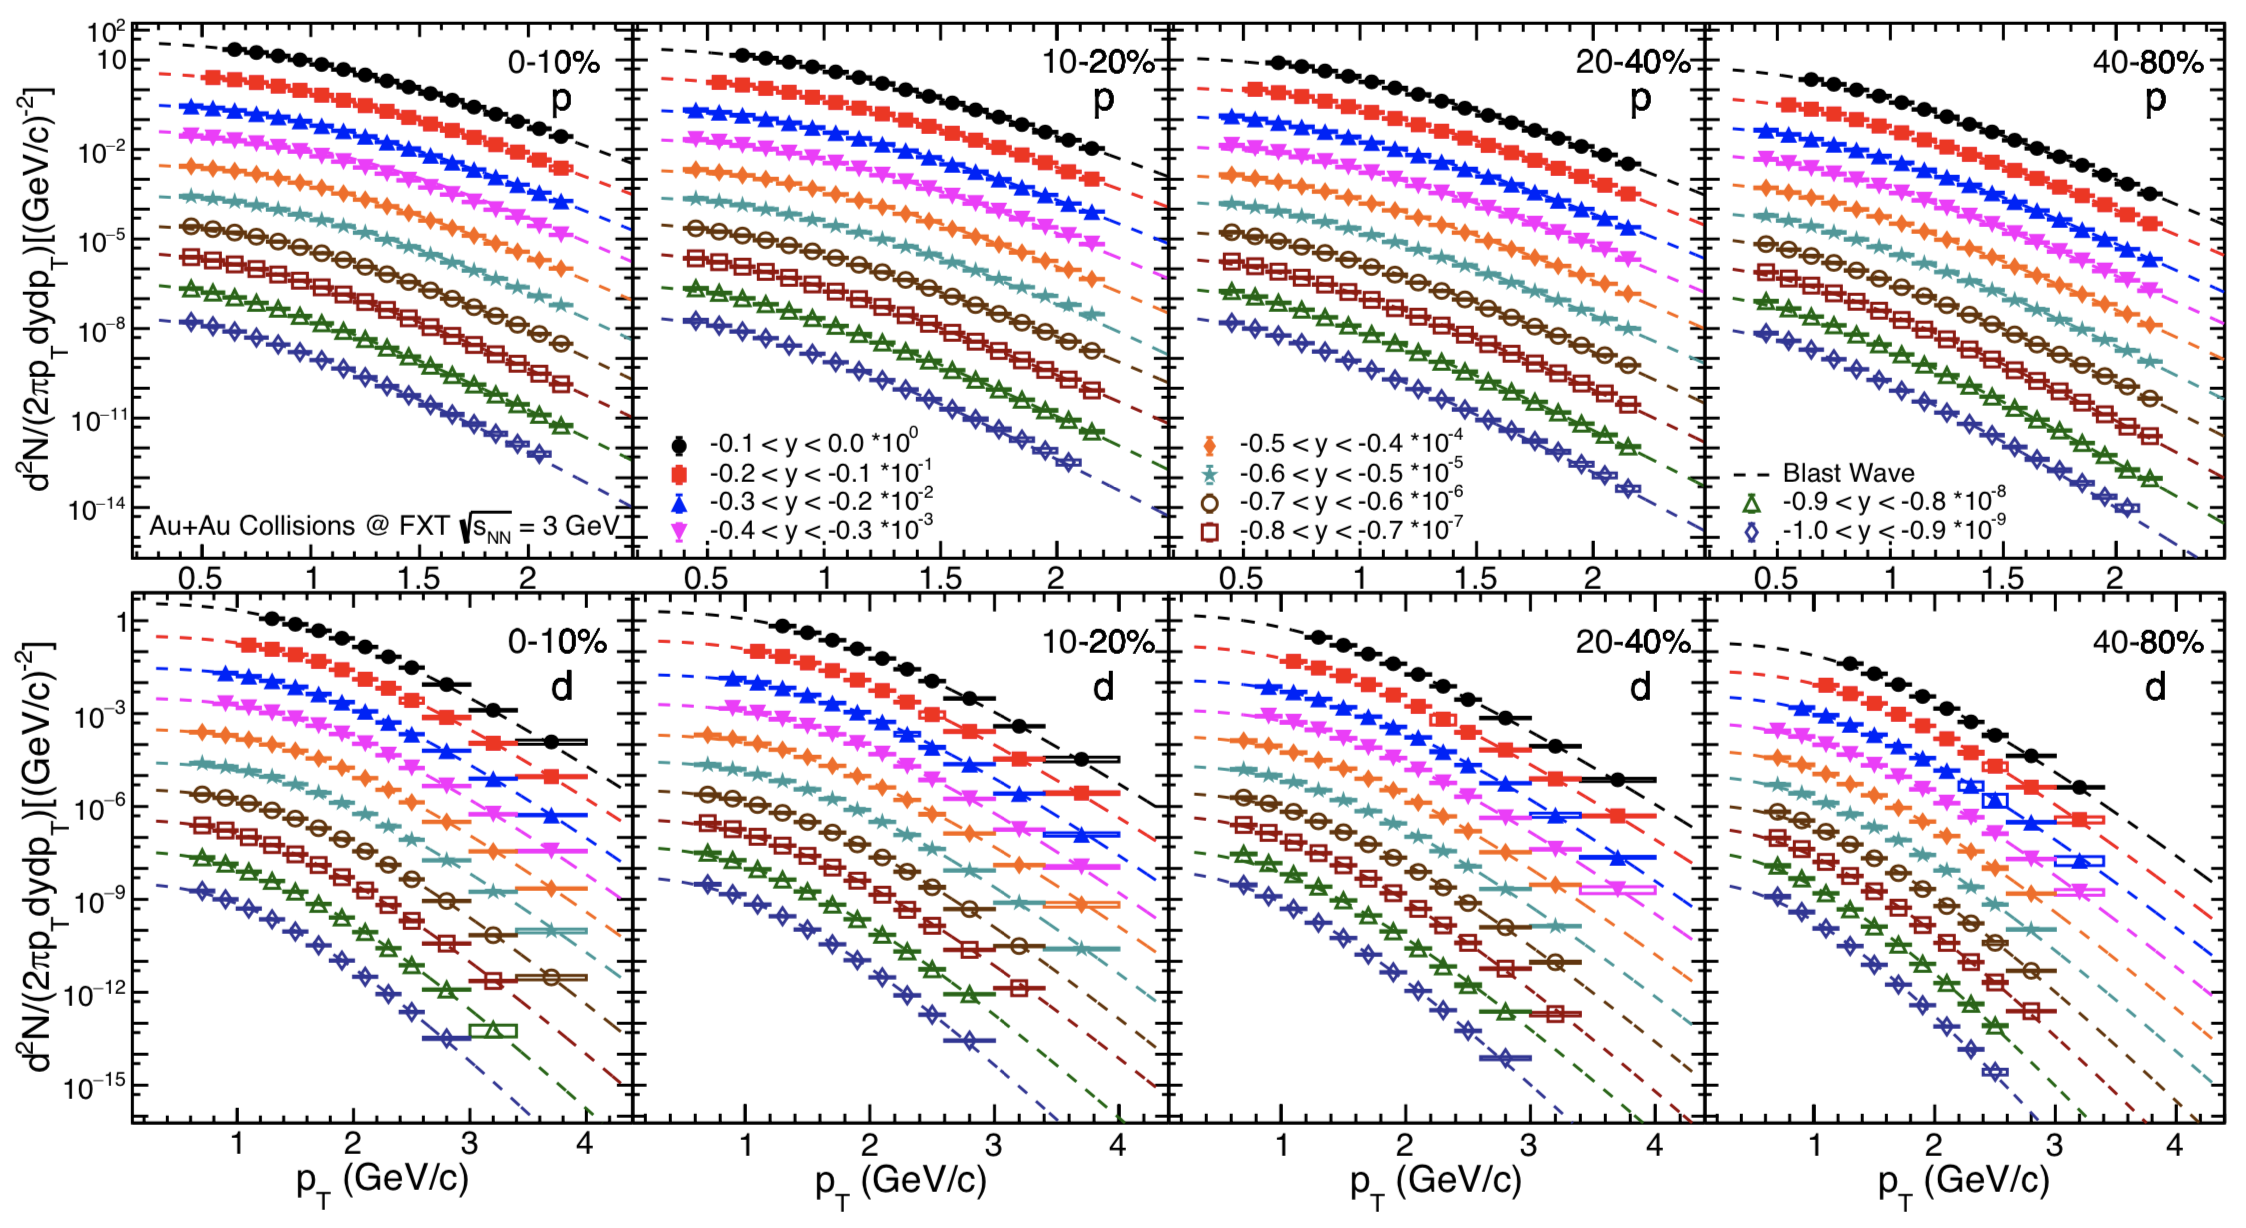
Fig. 3. (top) Proton transverse momentum spectra for different rapidity ranges and centrality bins(0-10%, 10-20%, 20-40% and 40-80%) in Au+Au collisions at √sNN = 3 GeV. To distinguish spectra clearly, they are scaled by a factor from 1 at mid-rapidity to 10e-9 at beam rapidity. Systematics uncertainties are represented by boxes. The dotted lines are fit by blast wave function. (bottom) Deuteron transverse momentum spectra for different rapidity ranges and centrality bins(0-10%, 10-20%, 20-40% and 40-80%) in Au+Au collisions at √sNN = 3 GeV.
Figure 4:
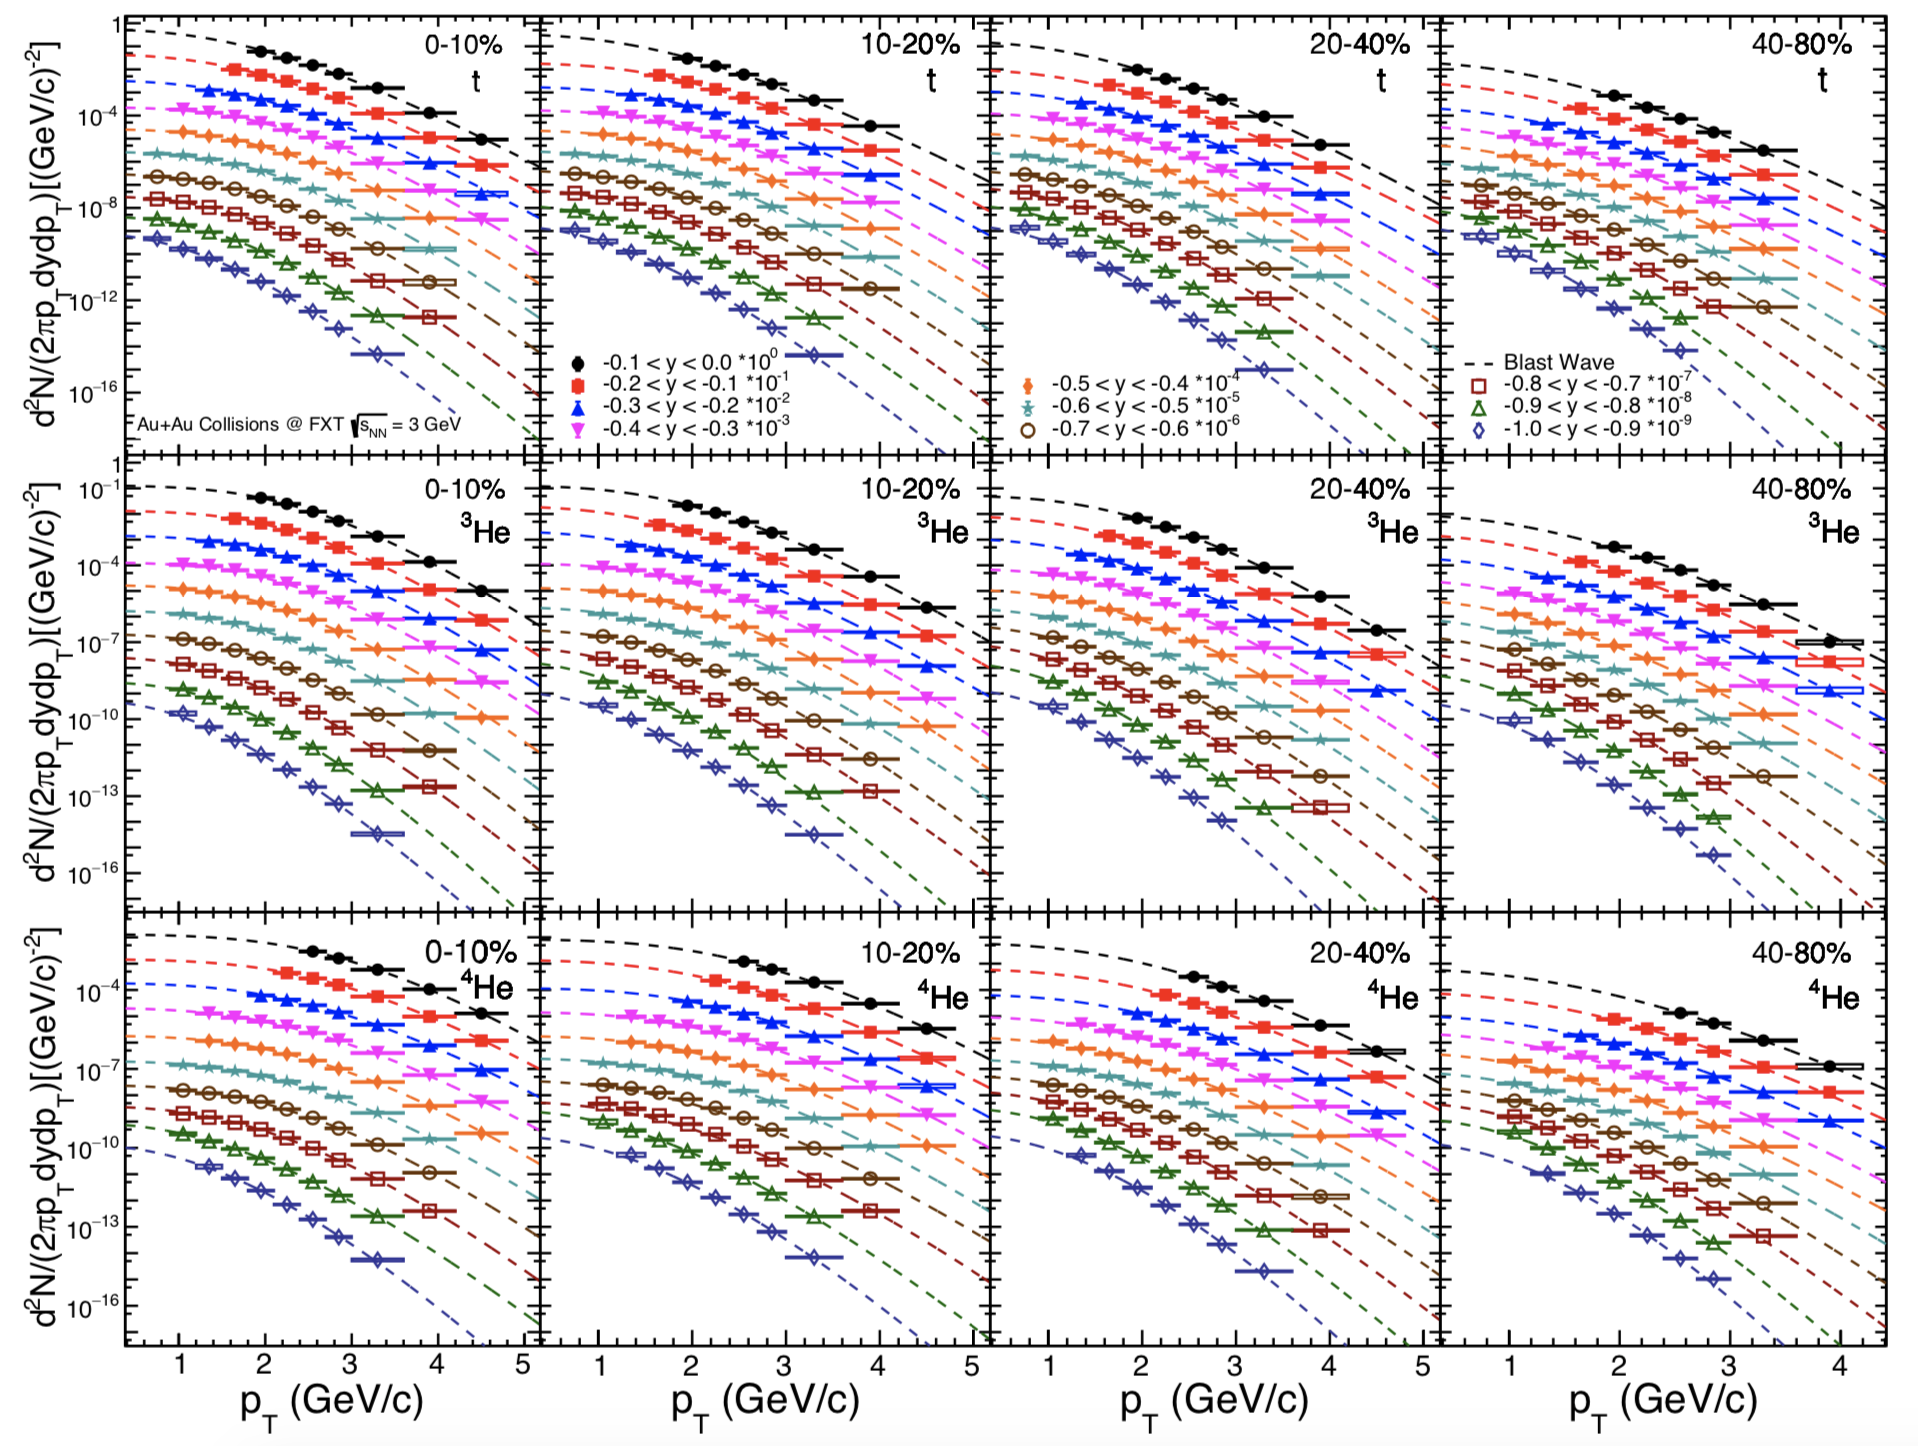
Fig. 4. (top) Triton transverse momentum spectra for different rapidity ranges and centrality bins(0-10%, 10-20%, 20-40% and 40-80%) in Au+Au collisions at √sNN = 3 GeV. To distinguish spectra clearly, they are scaled by a factor from 1 at mid-rapidity to 10e-9 at beam rapidity. Systematics uncertainties are represented by boxes. The dotted lines are fit by blast wave function. (middle) Helium3 transverse momentum spectra for different rapidity ranges and centrality bins(0-10%, 10-20%, 20-40% and 40-80%) in Au+Au collisions at √sNN = 3 GeV. (bottom) Helium4 transverse momentum spectra for different rapidity ranges and centrality bins(0-10%, 10-20%, 20-40% and 40-80%) in Au+Au collisions at √sNN = 3 GeV.
Figure 5:
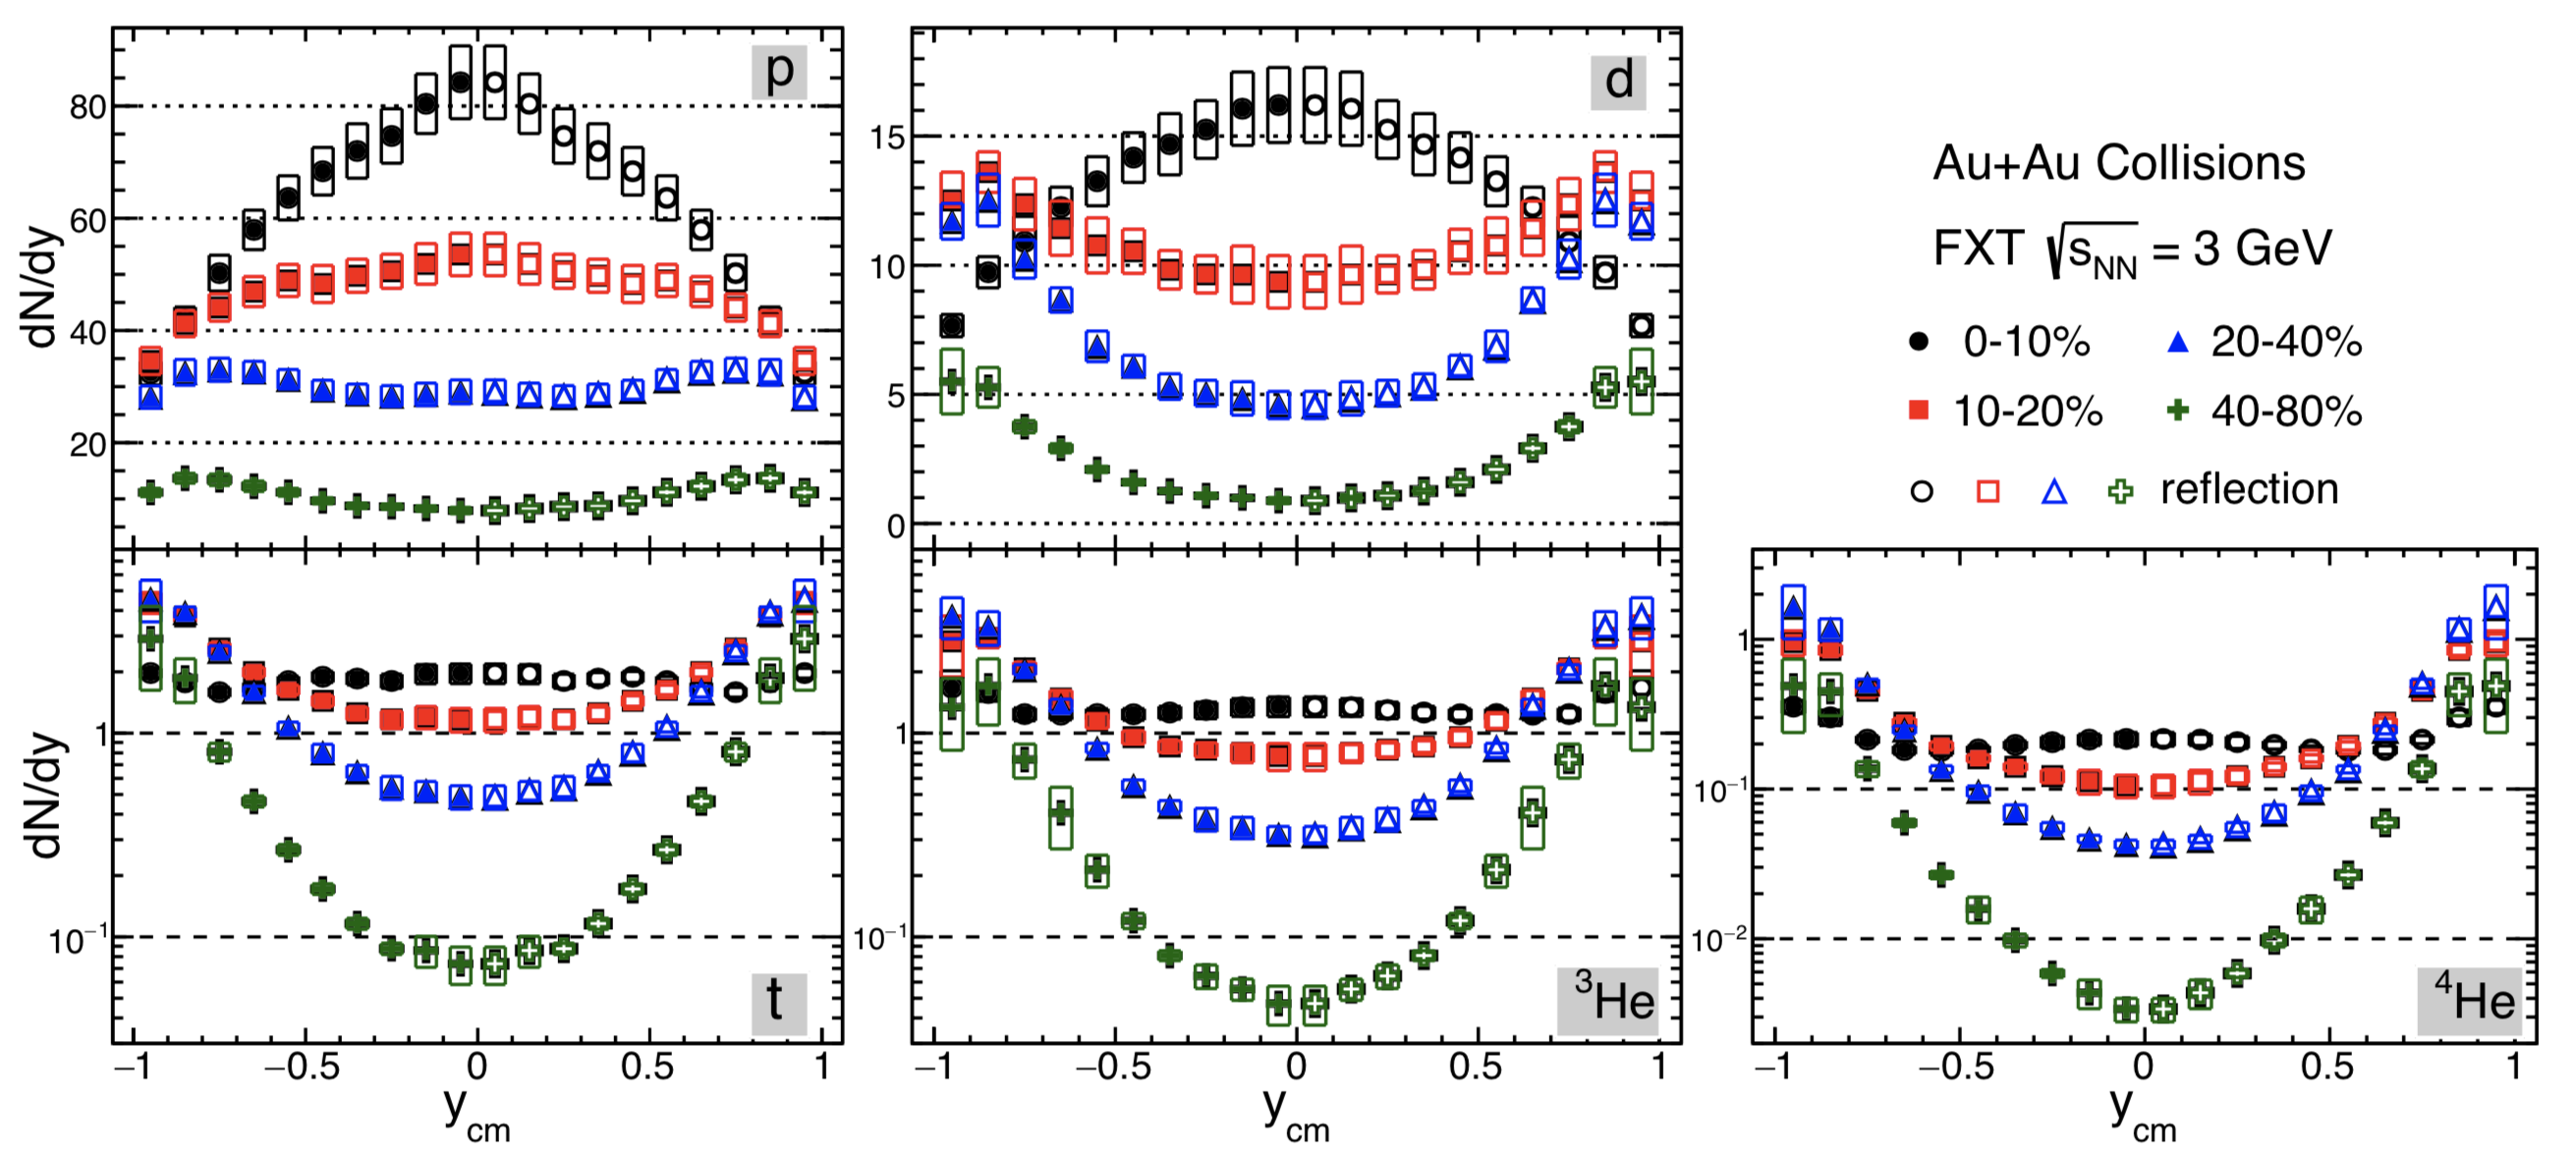
Fig. 5. The rapidity density distributions(dN/dy) of particles for different centrality bins in Au+Au collisions at √sNN = 3 GeV. The solid markers indicate the measured rapidity ranges, the open markers are reflected by measured results. The boxes indicate the systematical uncertainties.
Figures 6:
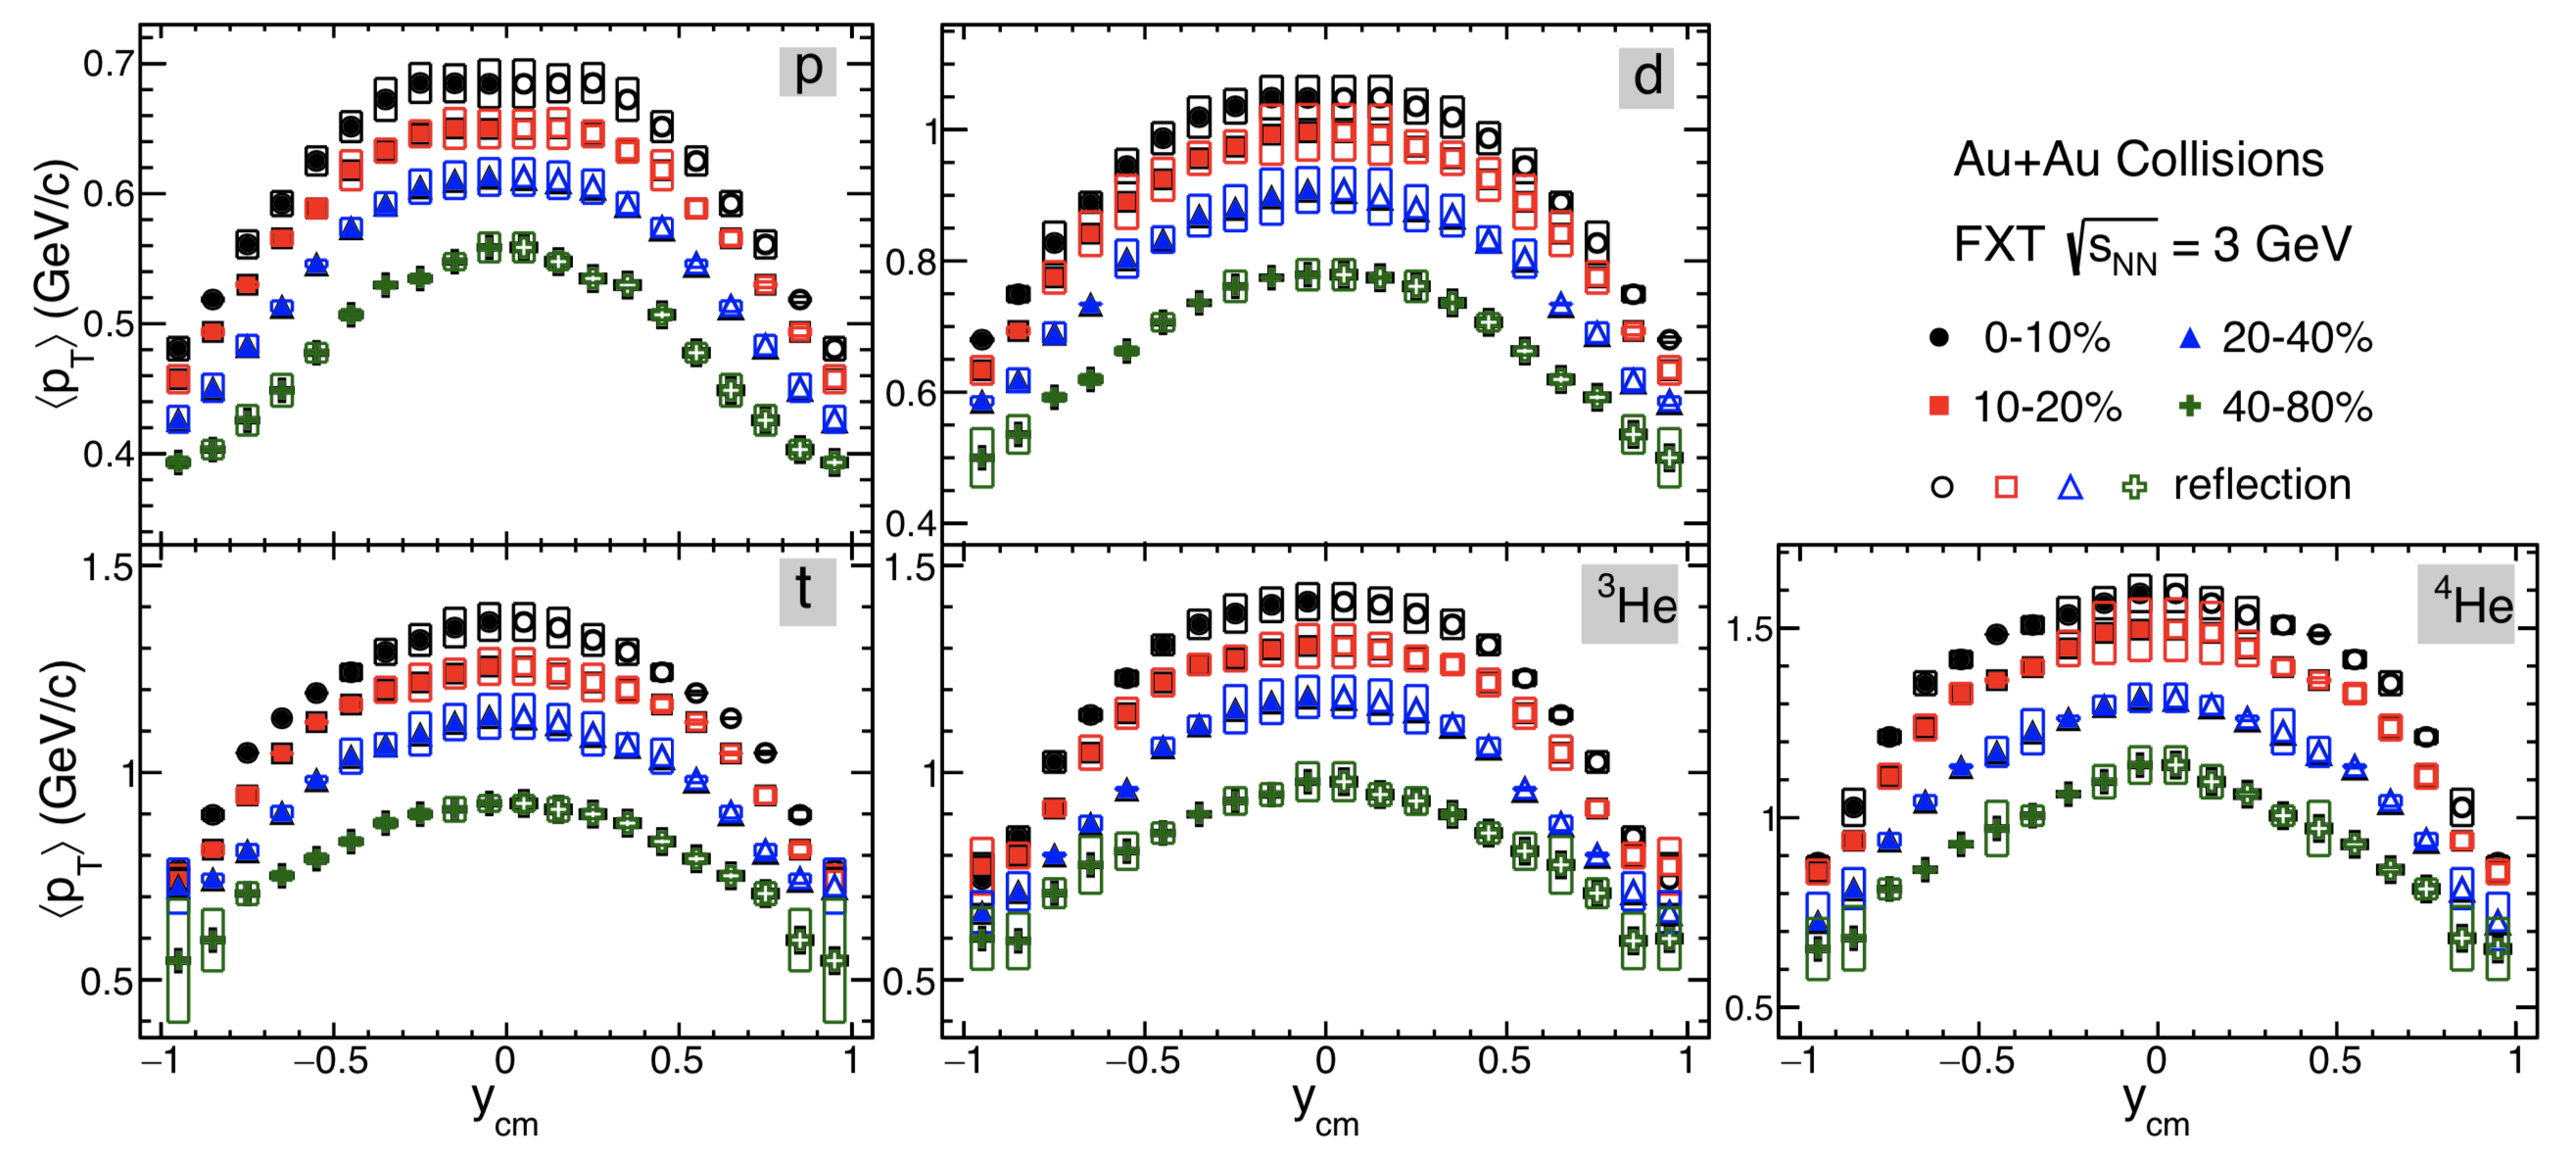
Fig. 6. Rapidity dependence of <pT> of particles for different centrality bins in Au+Au collisions at √sNN = 3 GeV. The solid markers indicate the measured rapidity ranges, the open markers are reflected by measured results. The boxes indicate the systematical uncertainties.
Figure 7:
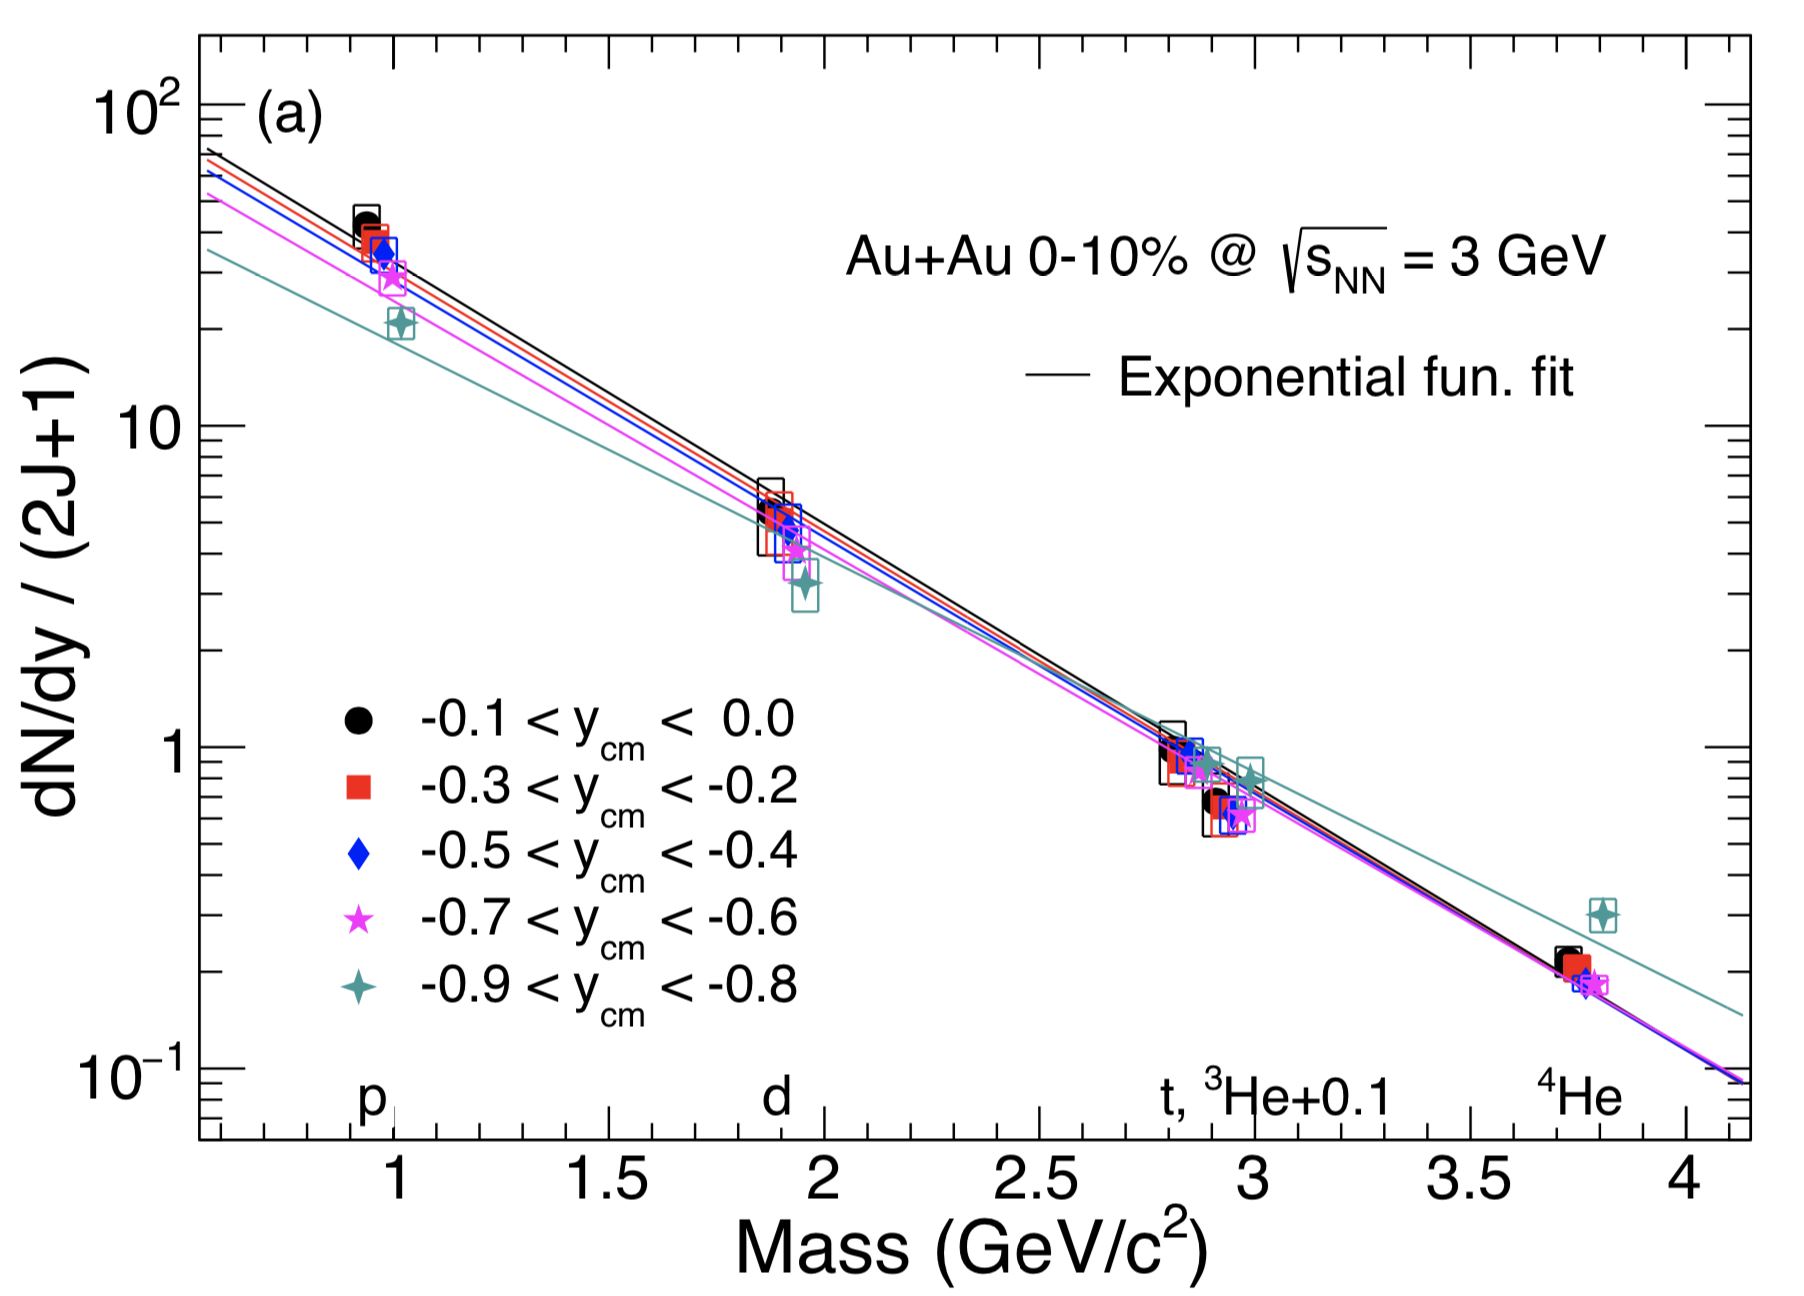
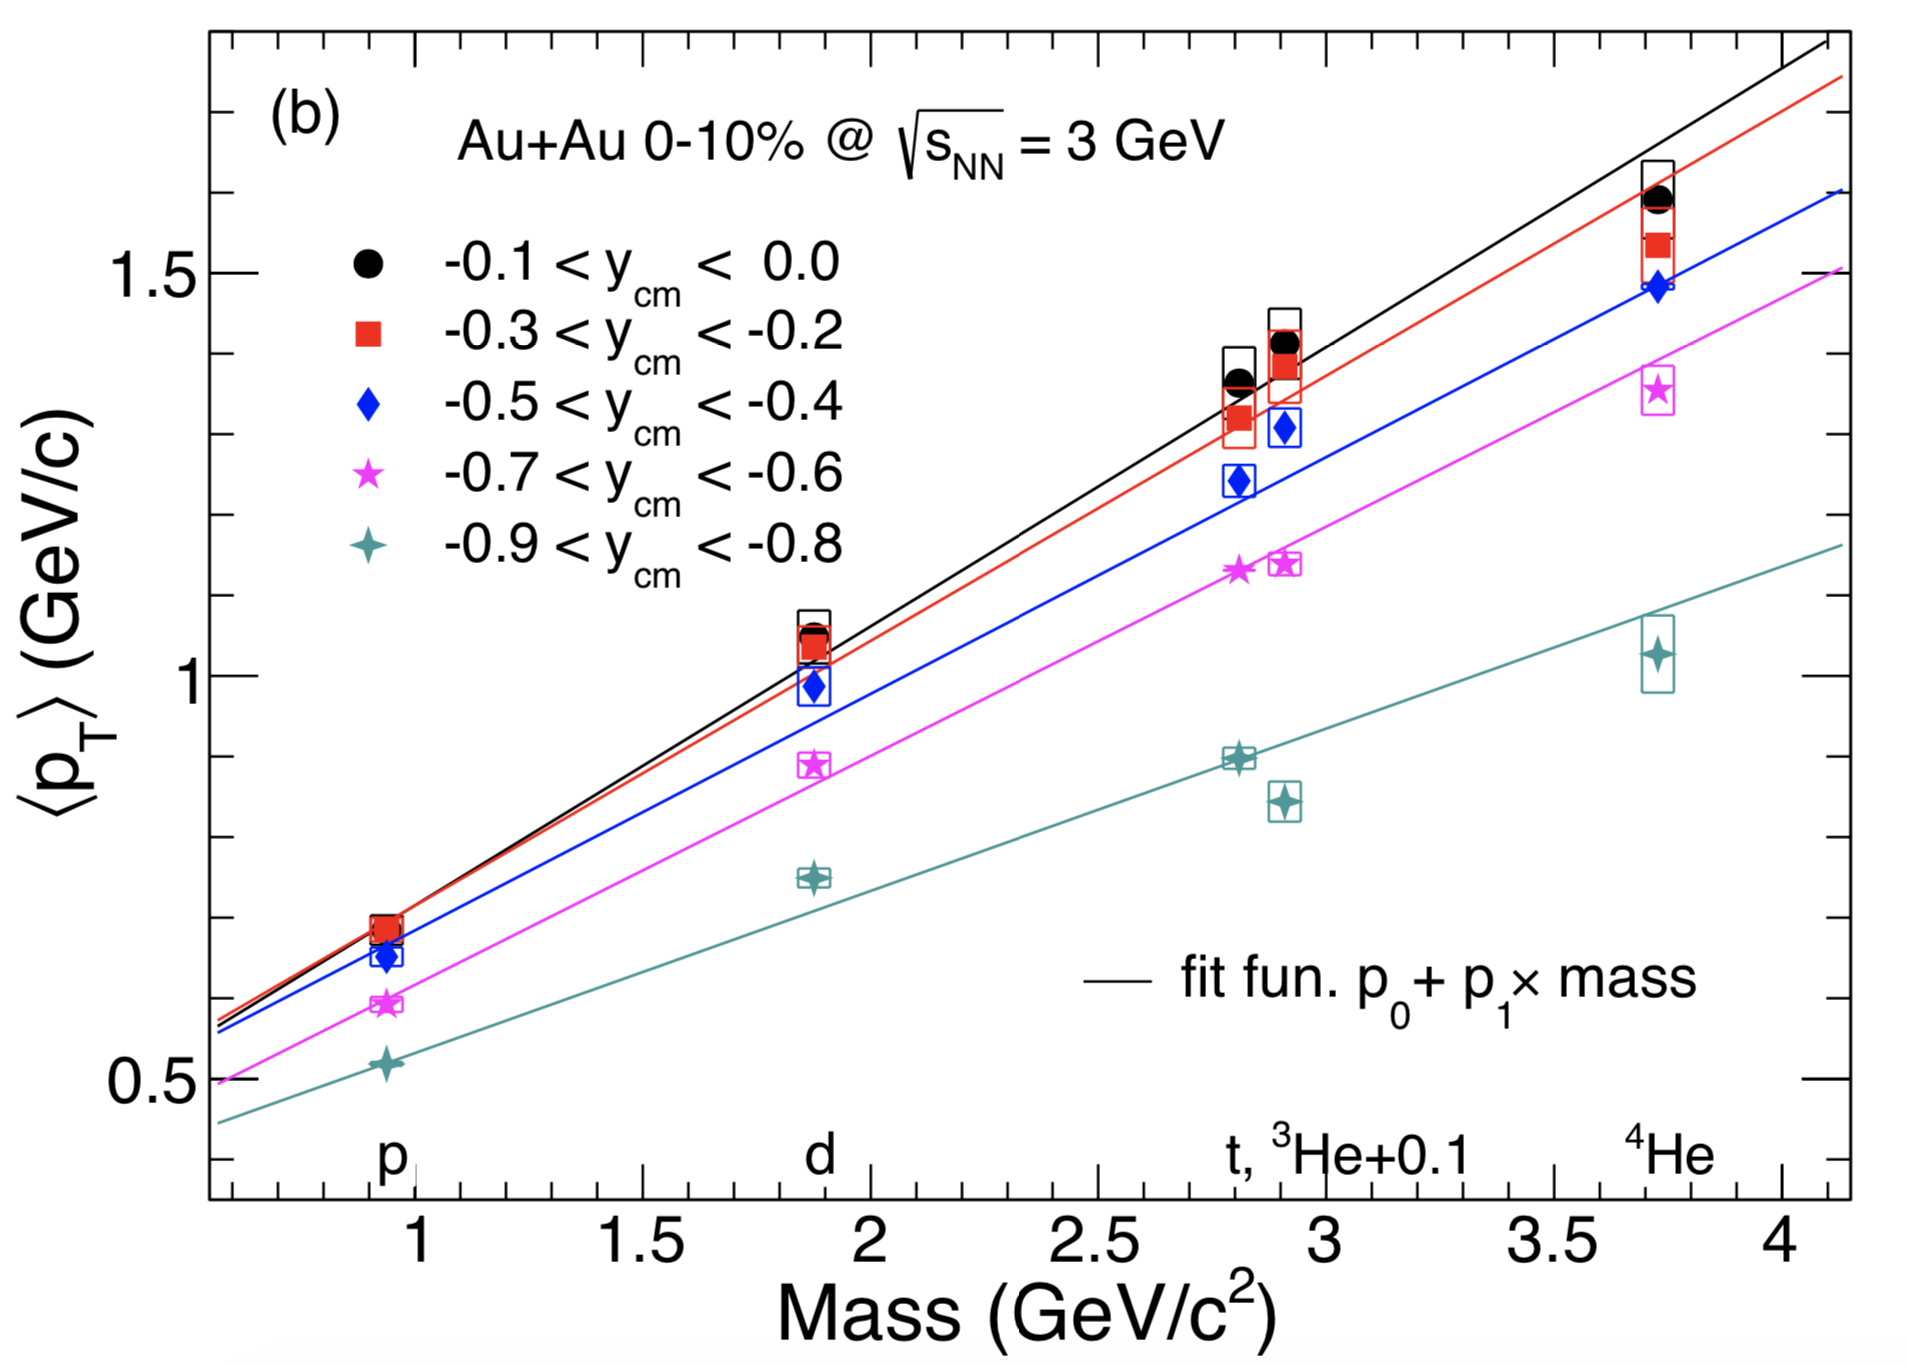
Fig. 7. (a) dN/dy normalized by spin degeneracy factor as an exponential function of the particle mass in Au+Au collisions at √sNN = 3 GeV. Rapidity windows are distinguished by different colorful Markers. The boxes indicate the systematical uncertainties. The solid lines represent the fit with exponential function. (b) <pT> as a linear function of the particle mass in Au+Au collisions at √sNN = 3 GeV. Rapidity windows are distinguished by different colorful Markers. The boxes indicate the systematical uncertainties.
Figure 8:
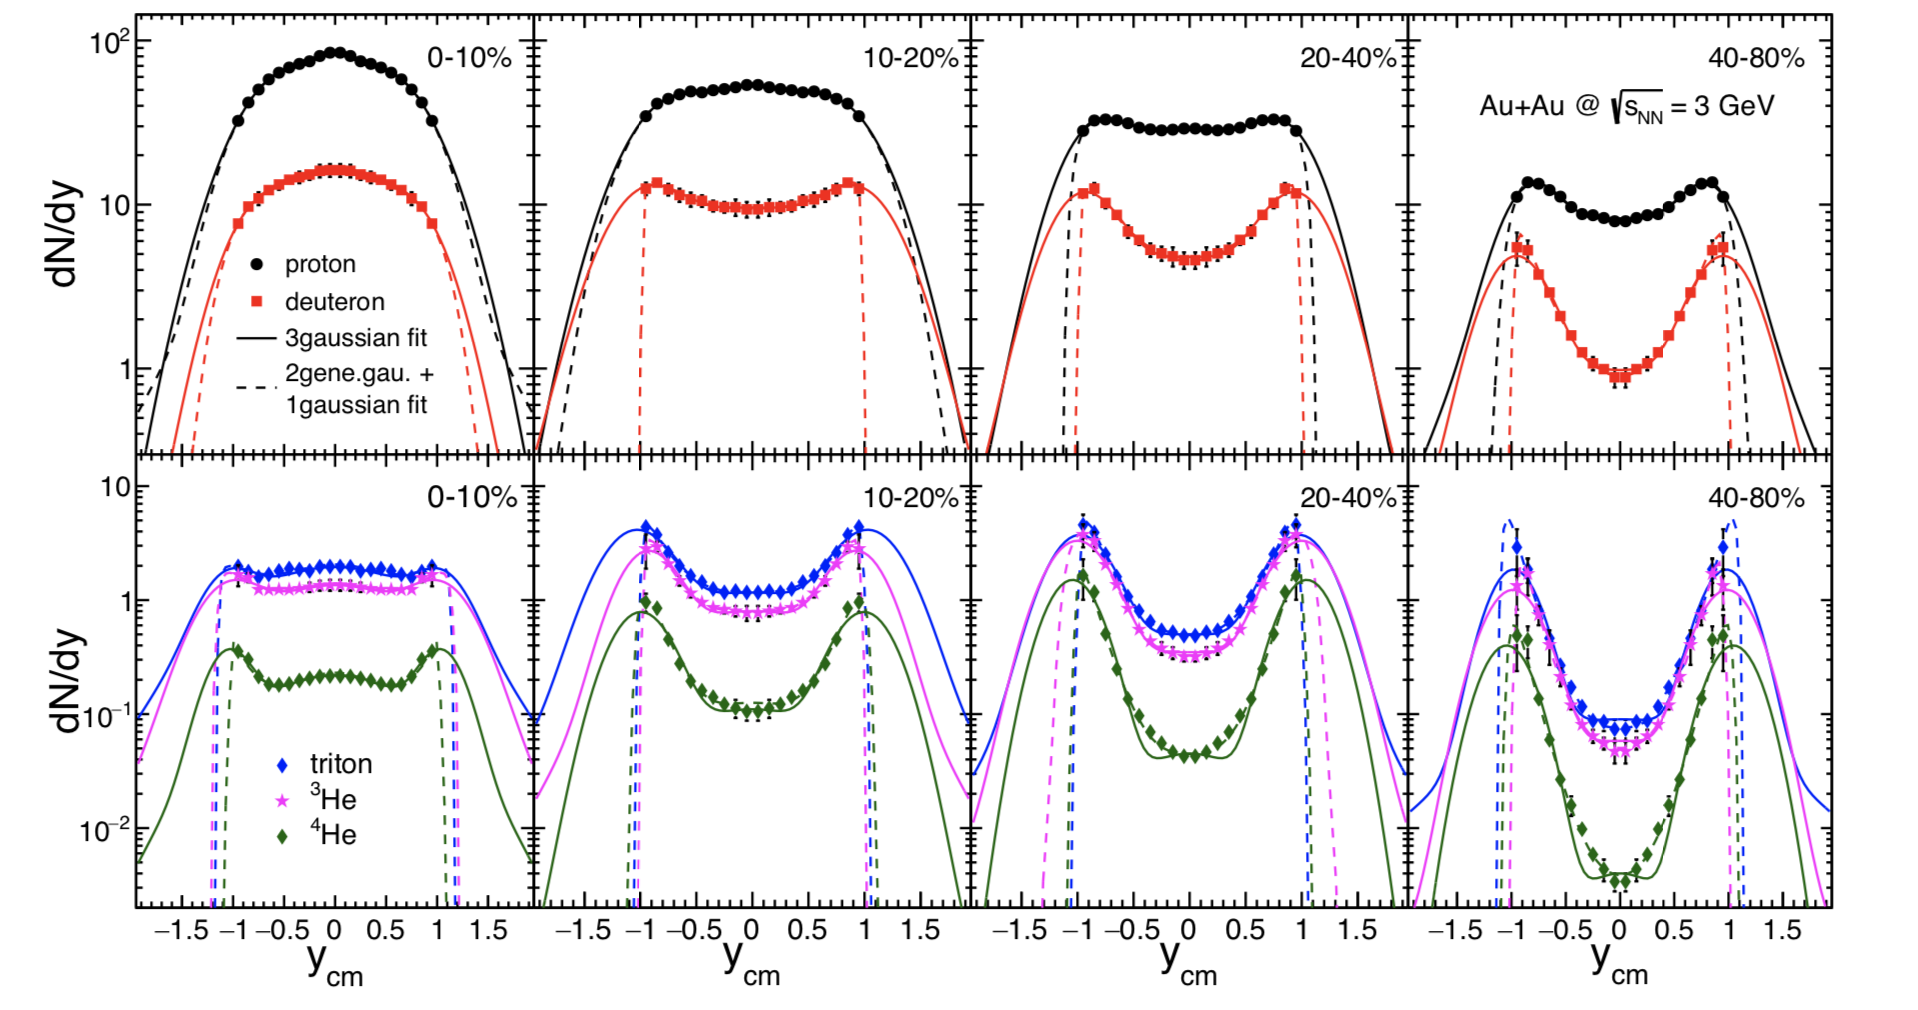
Fig. 8. The rapidity dependence of dN/dy of particles in Au+Au collisions at √sNN = 3 GeV. The solid lines represent the distribution fit by 3 gaussians function. The dashed lines represent the distribution fit by 2 generalized gaussians + 1 gaussian function.
Figure 9:
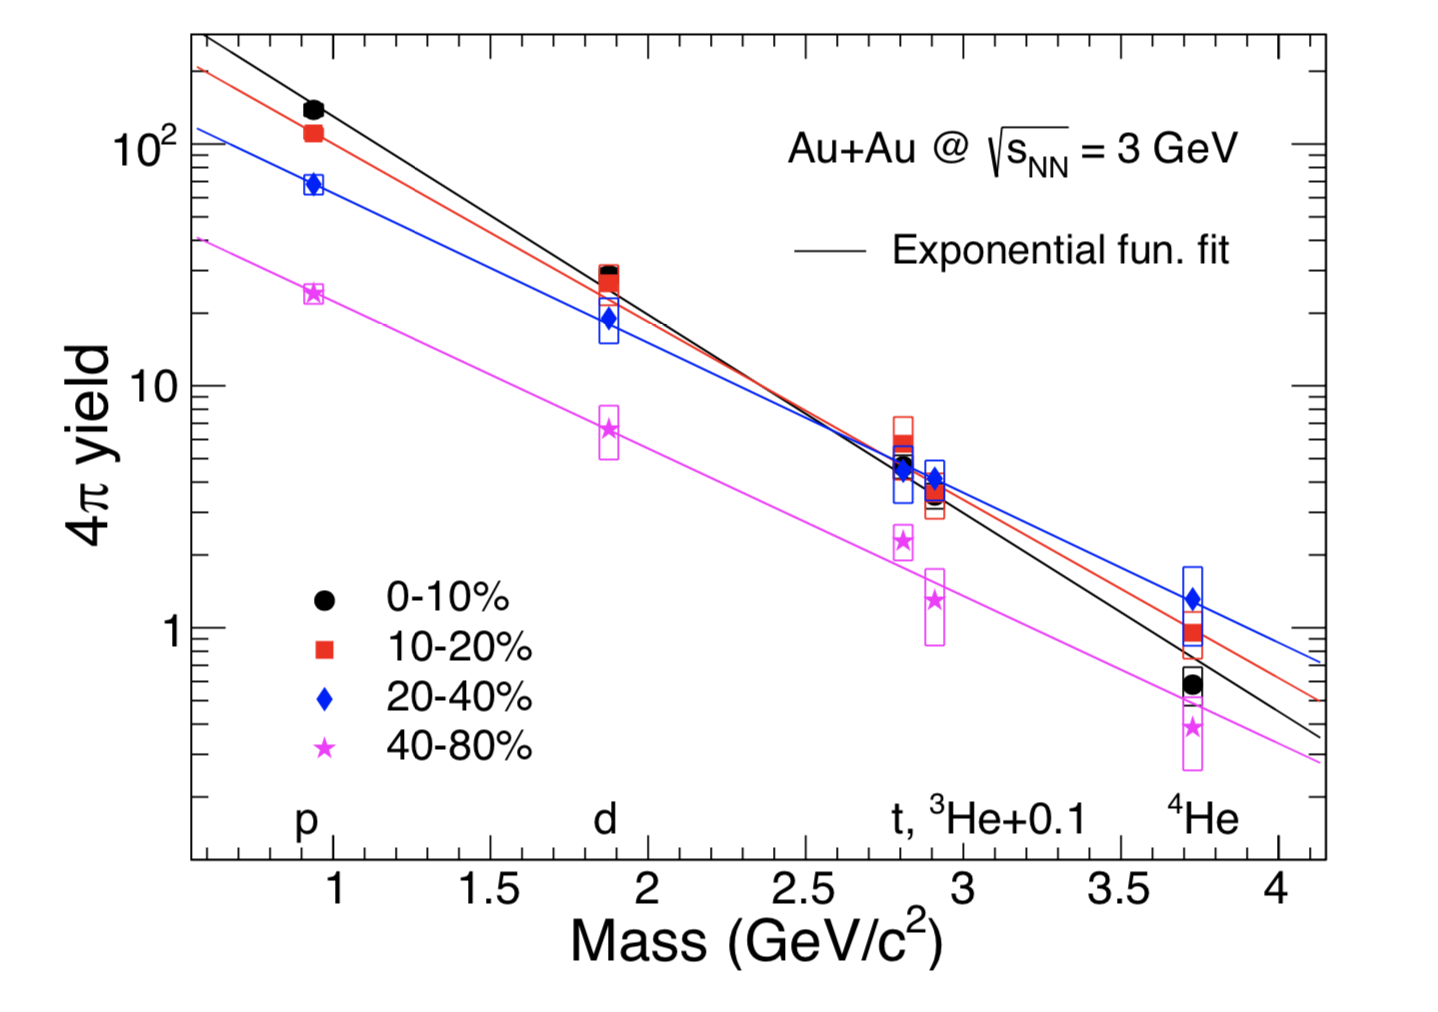
Fig. 9. 4pi yield as an exponential function of the particle mass in Au+Au collisions at √sNN = 3 GeV. The boxes represent the quadratic sums of the measured errors and the extrapolation uncertainties.
Figure 10:
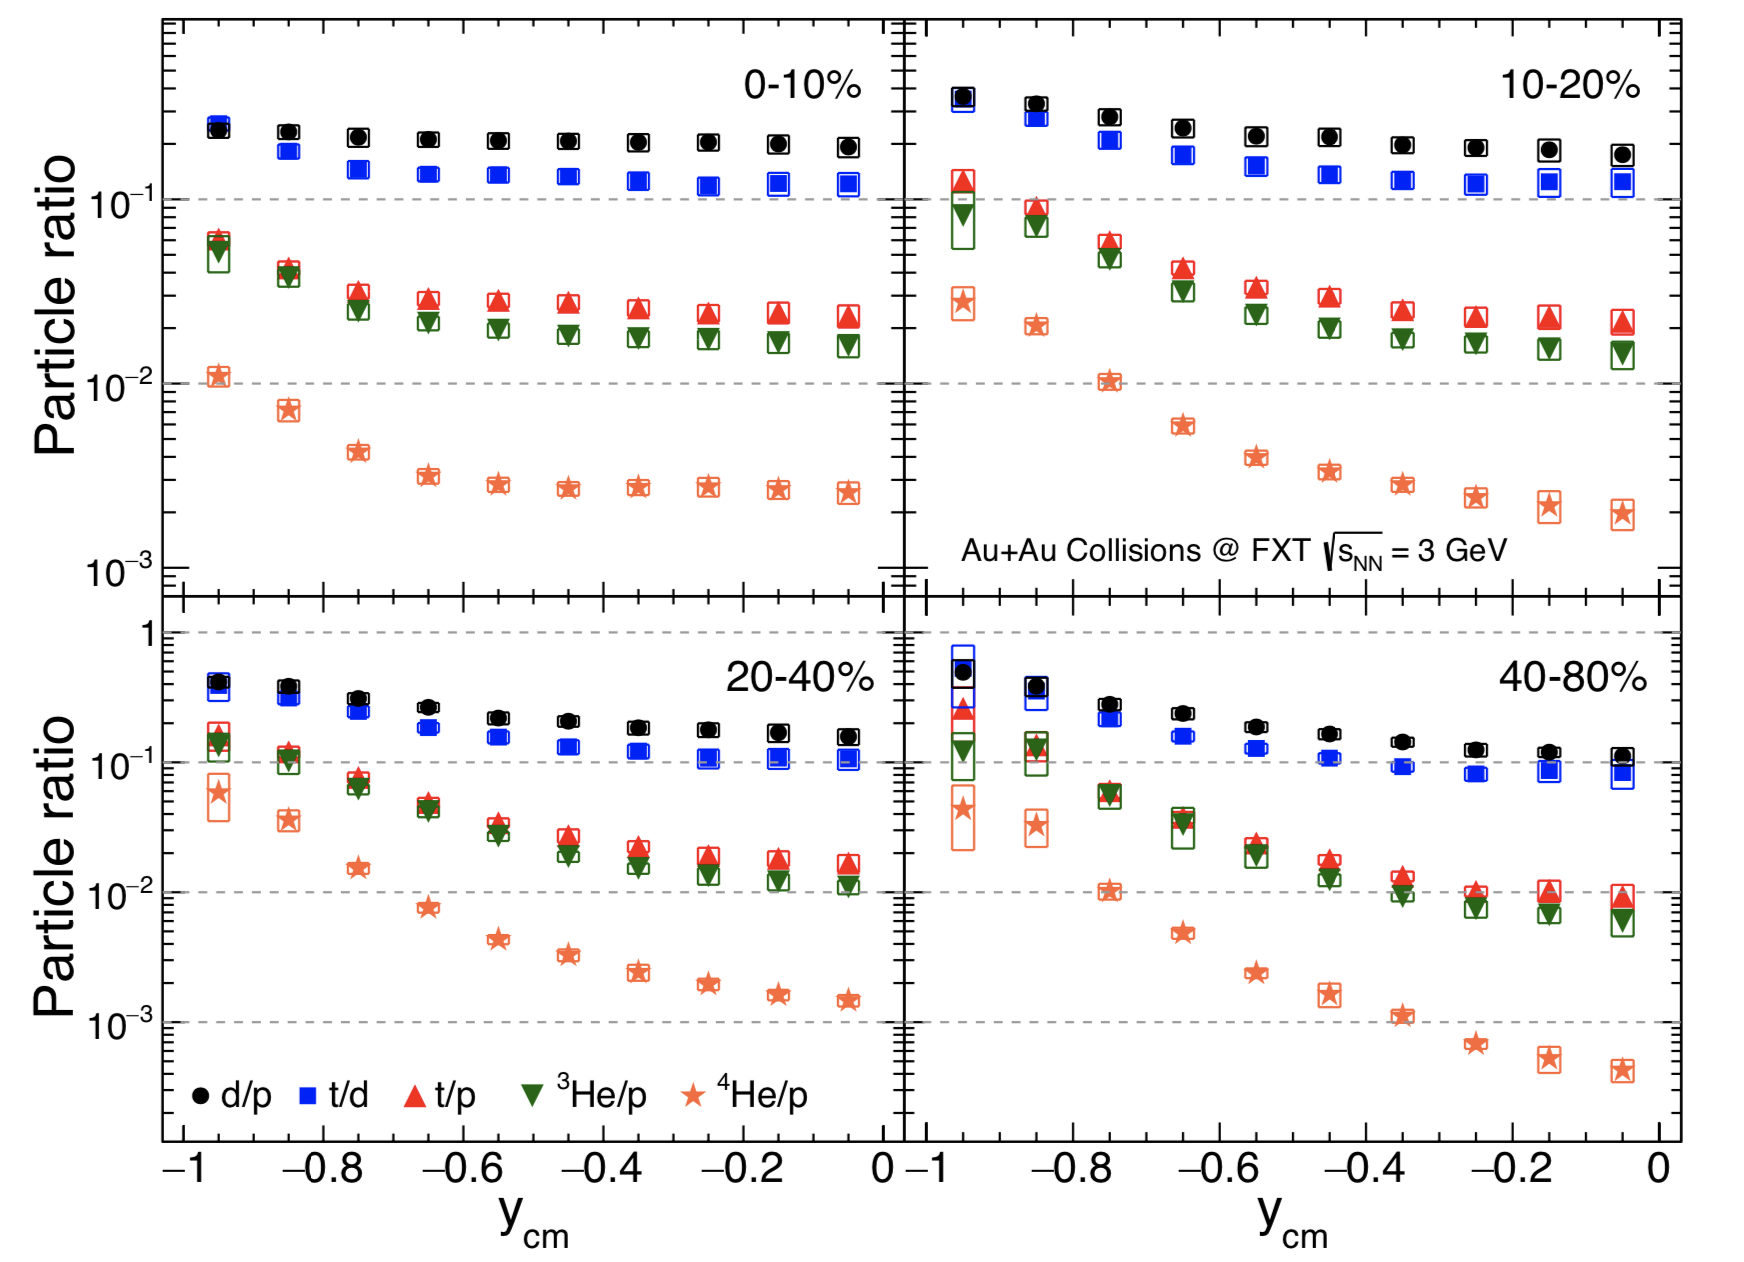
Fig. 10. Rapidity dependence of d/p, t/d, t/p, he3/p and he4/p for different centrality bins in Au+Au collisions at √sNN = 3 GeV. The boxes indicate the systematical uncertainties.
Figure 11:
.png)
Fig. 11. Energy dependence of d/p and anti-d/anti-p yield ratios. The vertical lines indicate statistical uncertainties. The boxes indicate the systematical uncertainties. The curves represent the thermal model results.
Figure 12:
.png)
Fig. 12. Rapidity dependence of the coalescence parameter for B2(d), √B3(t) and √B3(He3) at pT/A = 0.65 GeV/c for different centrality bins in Au+Au collisions at √sNN = 3 GeV. The bands represent the systematical uncertainties.
Figure 13:
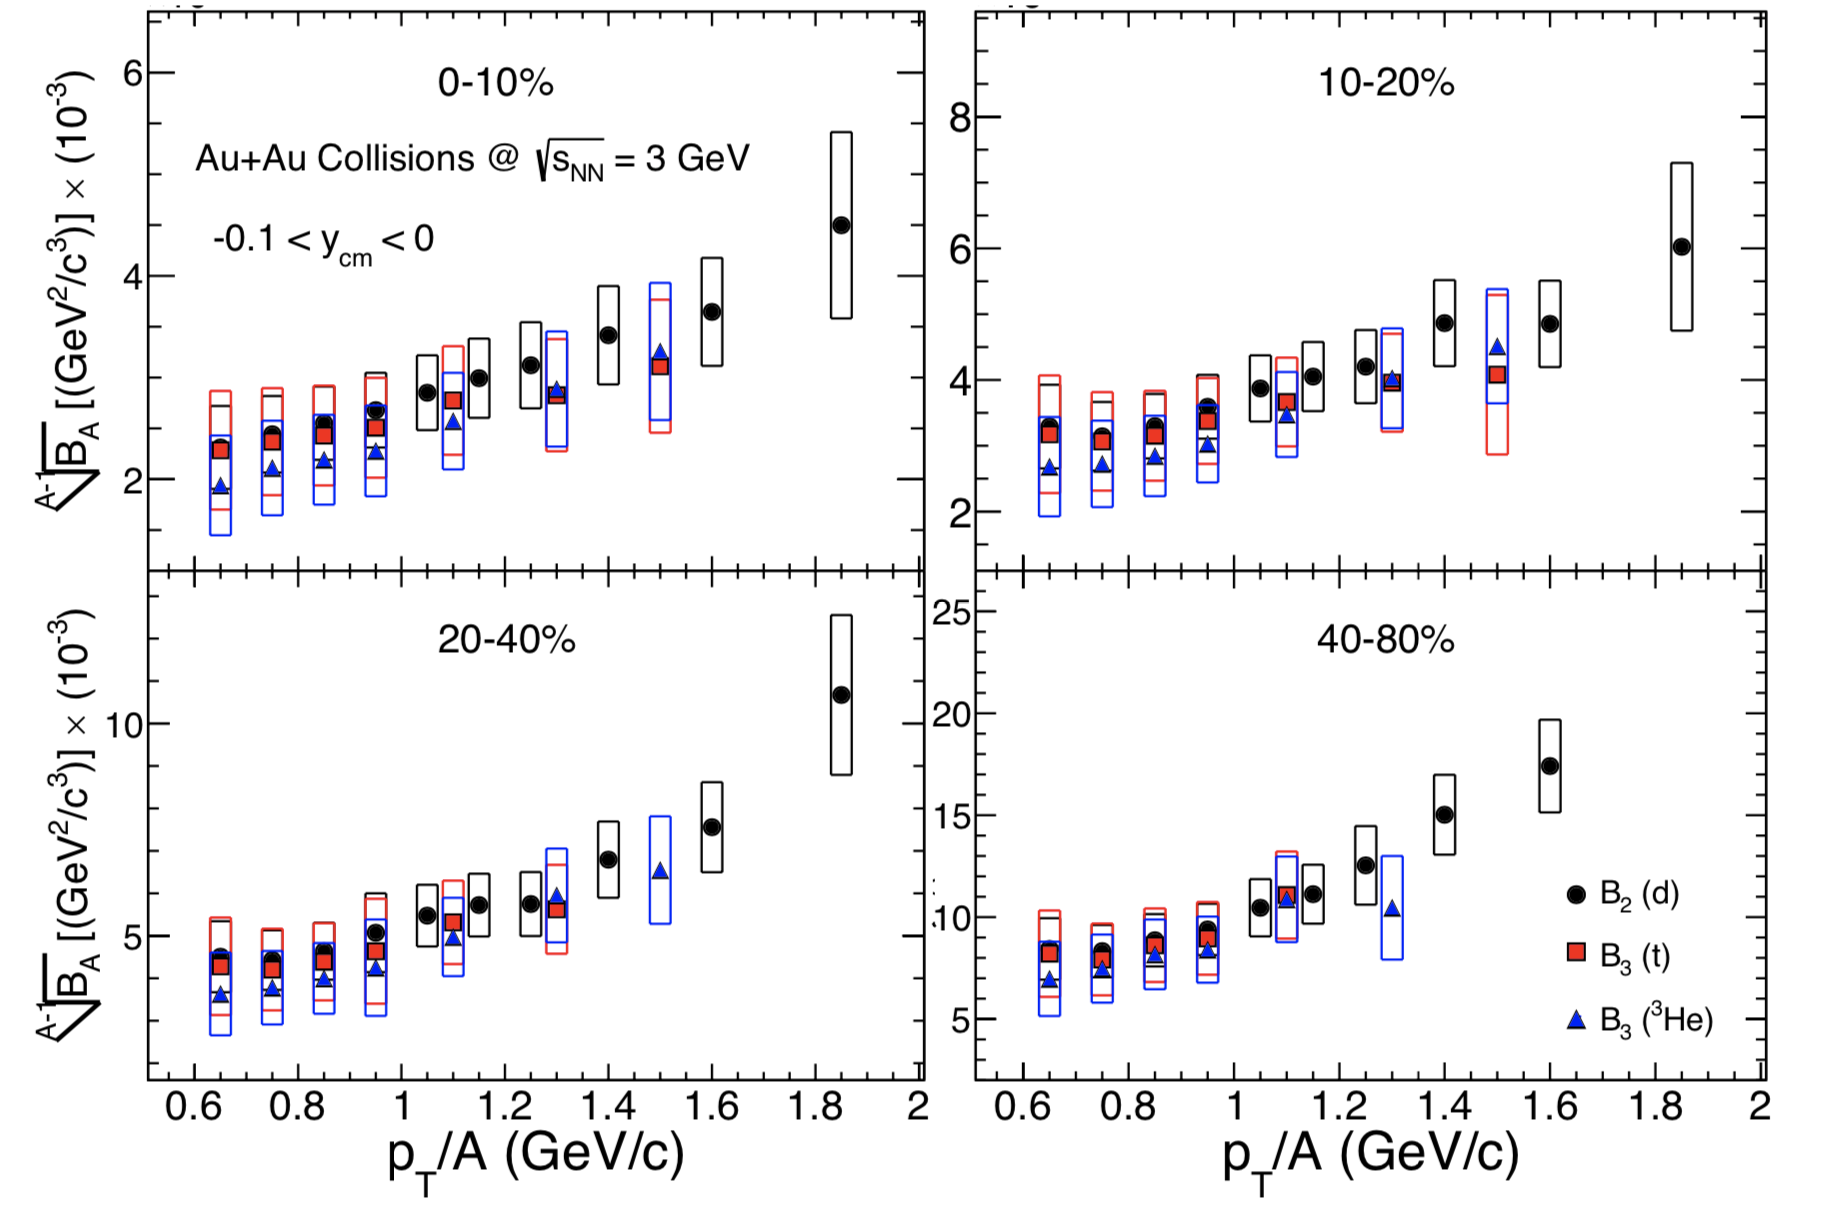
Fig. 13. Coalescence parameters B2(d), √B3(t) and √B3(He3) as a function of pT/A for different centrality bins in Au+Au collisions at √sNN = 3 GeV. The boxes represent the systematical uncertainties.
Figure 14:
.png)
Fig. 14. Energy dependence of the coalescence parameters for B2(d) and B3(3He) from central collisions. The vertical lines indicate statistical uncertainties. The boxes indicate the systematical uncertainties.
Figure 15:
.png)
Fig. 15. Rapidity dependence of the yield ratio for Np*Nt/Nd2, N4He*Np/(N3He*Nd) and N4He*Nt*Np2/(N3He*Nd3) for different centrality bins in Au+Au collisions at √sNN = 3 GeV. The bands represent the systematical uncertainties.
Figure 16:
.png)
Fig. 16. Energy dependence of Np*Nt/Nd2 at central collisions. The error bars represent statistical errors. The boxes indicate the systematical uncertainties.
Summary:
we have measured proton and light nuclei(d, t, 3He and 4He) production in Au+Au collisions at √sNN = 3 GeV from STAR experiment and presented the pT spectra, dN/dy and <pT> of particles from mid-rapidity to backward rapidity. we also calculated the 4pi yield of particles.
The coalescence parameters BA(d, t and 3He) and particle ratio (d/p, t/p) at mid-rapidity of central collisions follow the energy dependence trend as observed in STAR Beam Energy Scan-I and other experiment groups.
The yield ratio Np*Nt/Nd2 of mid-rapidity measured at 3 GeV follow the trend of world data.
Supporting materials:
presentations in PWG:
https://drupal.star.bnl.gov/STAR/system/files/201207light_nuclei_production_at_FXT_3GeV.pdf
https://drupal.star.bnl.gov/STAR/system/files/201214light_nuclei_production_at_FXT_3GeV.pdf
https://drupal.star.bnl.gov/STAR/system/files/210104light_nuclei_production_at_FXT_3GeV_SL20d.pdf
STAR collaboration meeting:
https://drupal.star.bnl.gov/STAR/system/files/210302_STARCollaborationMeeting_huiliu.pdf
APS 2021:
https://drupal.star.bnl.gov/STAR/system/files/APS2021_LightNuclei_HuiLiu.pdf
- huiliu's blog
- Login or register to post comments