QM2018 EPD poster abstract
See the most current version of the poster here https://drupal.star.bnl.gov/STAR/system/files/upsal_QM18poster_current.pdf
//------------------------submitted abstract-------------------------------------//
Title: Charged particle yields and anisotropic flow at forward rapidities from Au+Au collisions at 54GeV using the STAR Event Plane Detector.
The Event Plane Detector (EPD) is an upgrade to the STAR experiment that will significantly improve event plane resolution and provide a measure of collision centrality at forward rapidity ($2.1<|\eta|<5.1$). The complete detector, composed of two scintillator wheels at $\pm\eta$ and 2.1$<$$|\eta|$$<$5.1, will be operational in the 2018 run, but in 2017, a quarter of one wheel was commissioned. Results from this run including the partial EPD from Au+Au collisions at $\sqrt{\rm s_{\rm NN}}$$=$54 GeV will be presented. The track densities at this energy are considerably higher than those expected for RHIC Beam Energy Scan energies ($\sqrt{\rm s_{\rm NN}}$$\leq$20 GeV) for which the detector was originally designed. Nevertheless, the detector performed very well in this higher density environment. Preliminary pseudorapidity distributions and anisotropic flow ($v_1$ and $v_2$) results will be shown for forward rapidities measured by the EPD during the 2017 run.
//----------------------------------------------------------------------------------//
Book keeping:
-- What is being shown doesn't match the abstract. After Yang and I presented flow and dN/deta distributions of the 2017 1/4 wheel for 54GeV (https://drupal.star.bnl.gov/STAR/meetings/star-fall-2017-analysis-meeting/bulk-correlations-parallel-2/epd-54-gev) we planned on showing the physics data. What was clear from the presentations is that secondaries and low momentum particles may be distorting the results. To understand this we need a full GEANT simulation of the EPD which does not yet exist. Thus the focus of the poster was pivoted to be centrality (generally) and EP resolution in our only full EPD dataset -- the isobar run.
-- I reference Justin's poster which is based on EPD response and triggering (http://www.star.bnl.gov/HyperNews-star/protected/get/epd/451.html). Joey is also presenting a poster based on the construction of the EPD, this seemed less directly relevant.
-- Previous BulkCorr presentation can be found here: https://drupal.star.bnl.gov/STAR/blog/iupsal/isobarep
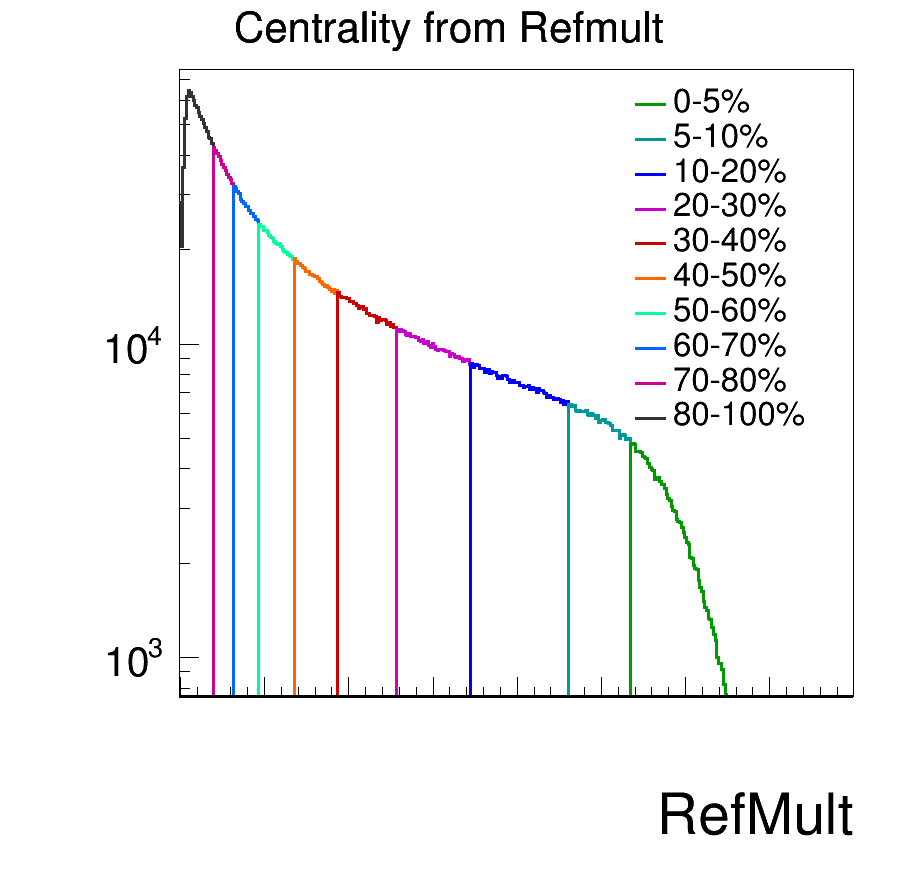
-- Centrality for the 2018 data is based on uncalibrated bare TPC track multiplicity percentages for some sample of the data which likely includes both RuRu and ZrZr. This is shown below. Naturally STAR doesn't take zero bias data, which is assumed, so the percentages aren't perfect. We just need something simple. Since the multiplicity is a secret axis labels have been removed.

-- The Q vector weight for the EPD was NMiP (ADC calibrated and fit by a Landau to get (statistically) the number of minimum ionizing particles that passed through the tile). If NMiP > 3, then NMiP = 3 (this is based on a study by Mike Lisa https://drupal.star.bnl.gov/STAR/blog/lisa/event-plane-detector-sees-event-plane-and-other-quantities). If NMiP < 0.3, then NMiP = 0. For the BBC the input is just raw ADC. Unfortunately this has not yet been looked at as a function of ring group, despite ShinIchi's keen interest. There are no set maxima/minima for the BBC ADC for consideration. The ADC spectrum of the BBC is a bit harder to interpret. Each tile has several fibers which are air-coupled to the scintillator and all connected to the same phototube.
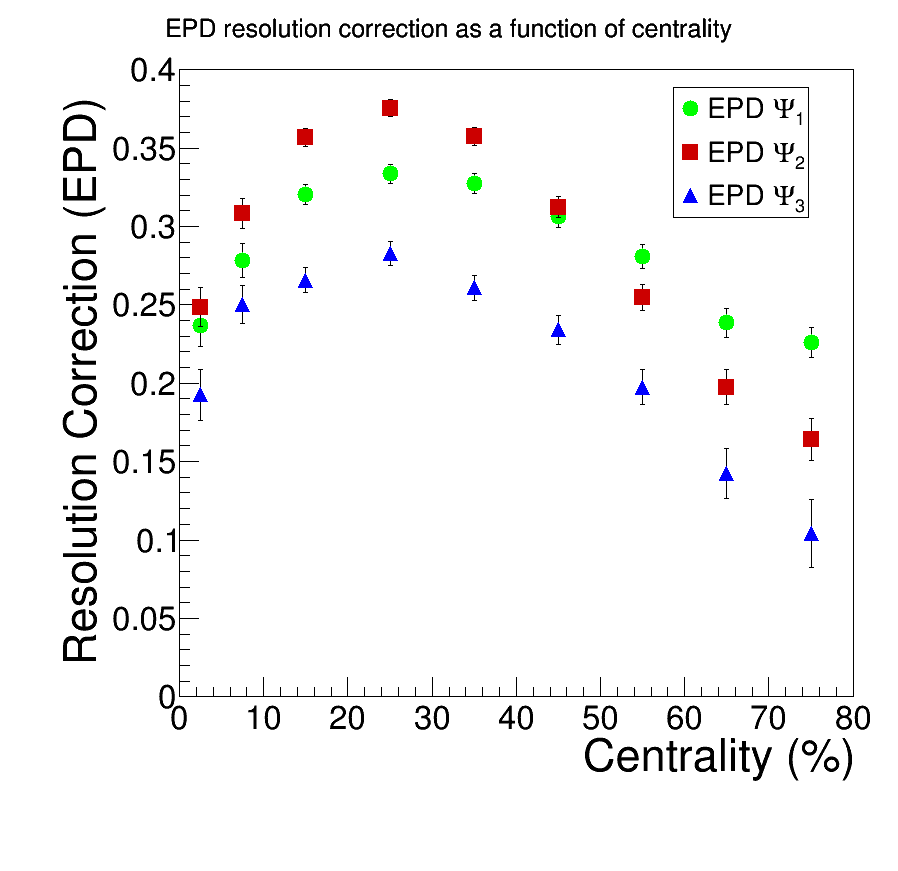
-- The EPD resolution isn't strongly dependent on performing the full suite of possible corrections. These are:
1) Gain/Phi weight: ensure that no tile is "hotter" (same average ADC/nMip) as it's equal-rapidity neighbors
2) Recentering: require the average Q vector component (Qx, Qy) is zero. That is, for a given event Qx_Recentered = Qx - <Qx_Recentered>. This can somewhat save you from saturation.
3) Shift: require the EP distribution is flat. Performed by subtracting off cosine and sine harmonics of the distribution. This is necessary for performing a resolution calculation, to avoid trivial correlations based on non-flat EP distributions
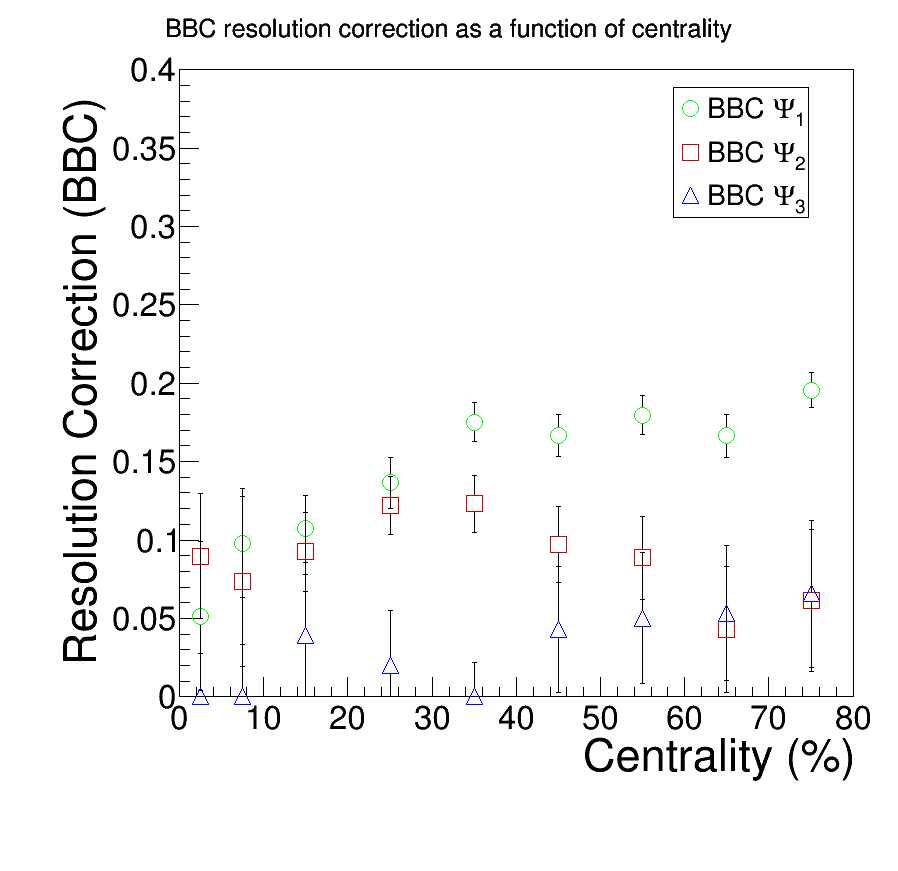
-- Because of the previous bullet point only the shift correction was performed for the EPD EP. For the BBC 1) and 3) where performed. The EPD ADC response is typically has much more variation than the already very-uniform EPD. This is for simplicity sake. Sometimes such corrections can go haywire and with QA one ought to keep it simple.
-- This study includes no complicated EPD ring-weighting scheme. That is for a later study. In principal the v1 resolution could depend significantly on the weights, since different species of particles have different flow distributions and the flow can change sign.
-- The resolution requires taking a sqrt of <cos(n*Psi_W - n*Psi_E)>. If <cos> < 0 this presents an obvious problem. A few such datapoints for Psi3 BBC had this problem. I've simply plotted them at zero. I can assure you that the negative correlation was clearly due to statistical error, as all of the resolution points hover around 0 with errors much larger than their deviations.
-- The two references are both for the PHOBOS data. Reference [1] is PHOBOS and reference [2] is from a group that took the data from [1] and replotted it with colors, which is nice. Should I not have reference [2]?
-- It is unclear why the BBC Psi1 resolution in the poster looks the way it does (kind of linearly rising with percentage). Maybe it's due to saturation effects (?).
-- Below I have comparisons a shuffled version of the resolution plots.


- iupsal's blog
- Login or register to post comments
