Run 17 Measurement of W+/W- cross section ratio at RHIC (Preliminary request)
Title
Measurement of $W^+/W^-$ cross-section ratio at RHIC
Abstract
While the unpolarized valence quark ($d$ and $u$) distributions are well determined from DIS experiments, the sea quark counterparts, $\bar{d}$ and $\bar{u}$, are much less constrained, in particular, near the valence region.
Measurements of $W^+/W^-$ production ratio in $pp$ collider experiments, such as the STAR experiment at RHIC, are sensitive to the $\bar{d}/\bar{u}$ ratio at leading order at a large $Q^2$ set by the $W$ mass.
The recently published $W$ and $Z/\gamma^*$ cross section measurements via lepton-decay tagging uses the STAR $pp$ collision data at a center-of-mass energy of $\sqrt{s} = 510\,\mathrm{GeV}$ collected during the years 2011-2013, corresponding to an integrated luminosity of $350\,\mathrm{pb^{-1}}$.
The present analysis provides a complementary measurement to the published result, using an additional dataset at $\sqrt{s} = 510 \,\mathrm{GeV}$ collected in 2017, corresponding to an integrated luminosity of $350\,\mathrm{pb^{-1}}$.
Summary
Preliminary request
Preliminary request (endcap)
Preliminary request (endcap) v2
Figures for preliminary request
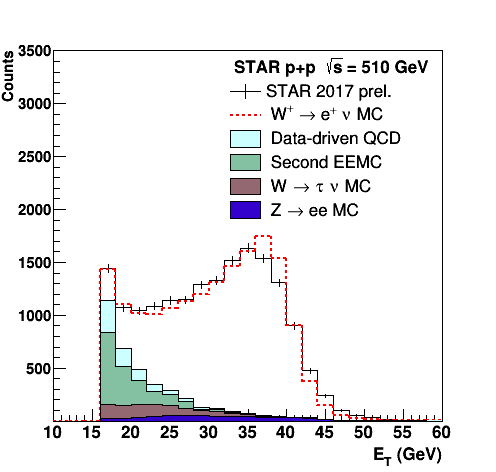
Figure 1. Signal and background $E_T^{e}$ distribution for positron candidates in the BEMC.
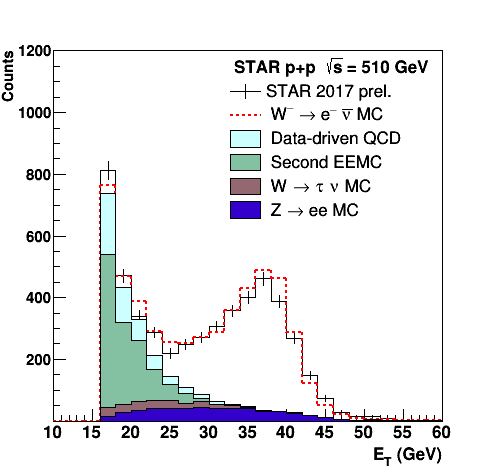
Figure 1. Signal and background $E_T^{e}$ distribution for electron candidates in the BEMC.
.png)
Figure 3.a: $W^+/W^-$ for STAR 2017 dataset against pseudorapidity. The central values correspond to the mean value of $\eta^{e}$ for that bin. The vertical bars represent the statistical uncertainty, whereas the height of the rectangles represents the systematic uncertainty for the respective data point. The measurement is compared to various theory framework with several PDF inputs.
.png)
Figure 3.b: $W^+/W^-$ for STAR 2017 dataset against pseudorapidity in comparison to the published measurement using combined STAR 2011 2012, and 2013 datasets. The central values correspond to the mean value of $\eta^{e}$ for that bin. The vertical bars represent the statistical uncertainty, whereas the height of the rectangles represents the systematic uncertainty for the respective data point. The measurement is compared to various theory framework with several PDF inputs.
.png)
Figure 3.a: $W^+/W^-$ for combined STAR 2011, 2012, 2013, and 2017 datasets against pseudorapidity. The central values correspond to the mean value of $\eta^{e}$ for that bin. The vertical bars represent the statistical uncertainty, whereas the height of the rectangles represents the systematic uncertainty for the respective data point. The measurement is compared to various theory framework with several PDF inputs.
(PNG format)
(PDF format)
(EPS format)
Figures for preliminary request (endcap)
.png)
Figure 1: Signal and background signed-$p_{T,bal}$ distributions for positron candidates in the EEMC.
.png)
Figure 2: Signal and background signed-$p_{T,bal}$ distributions for electron candidates in the EEMC.
.png)
Figure 3: Total efficiencies of electroweak positrons and electrons plotted as a function of the leptonic pseudorapidity.
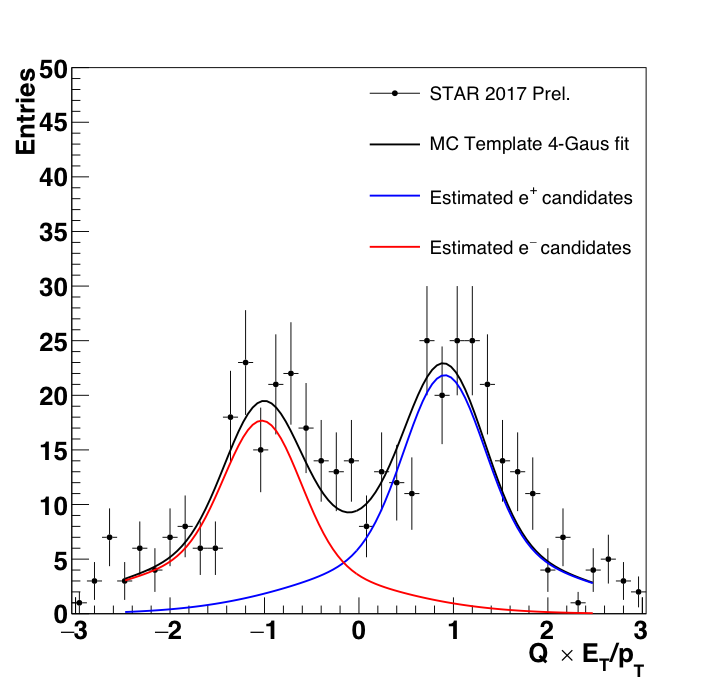
Figure 4: $Q \times E_{T}/p_{T}$ distributions from the STAR 2017 dataset. The black curve represents the 4-Gaus fit using the parameters obtained from fitting the MC distributions to a 2-Gaus function. The blue and red curves represent the estimated charge distributions for positron and electron candidates, respectively.
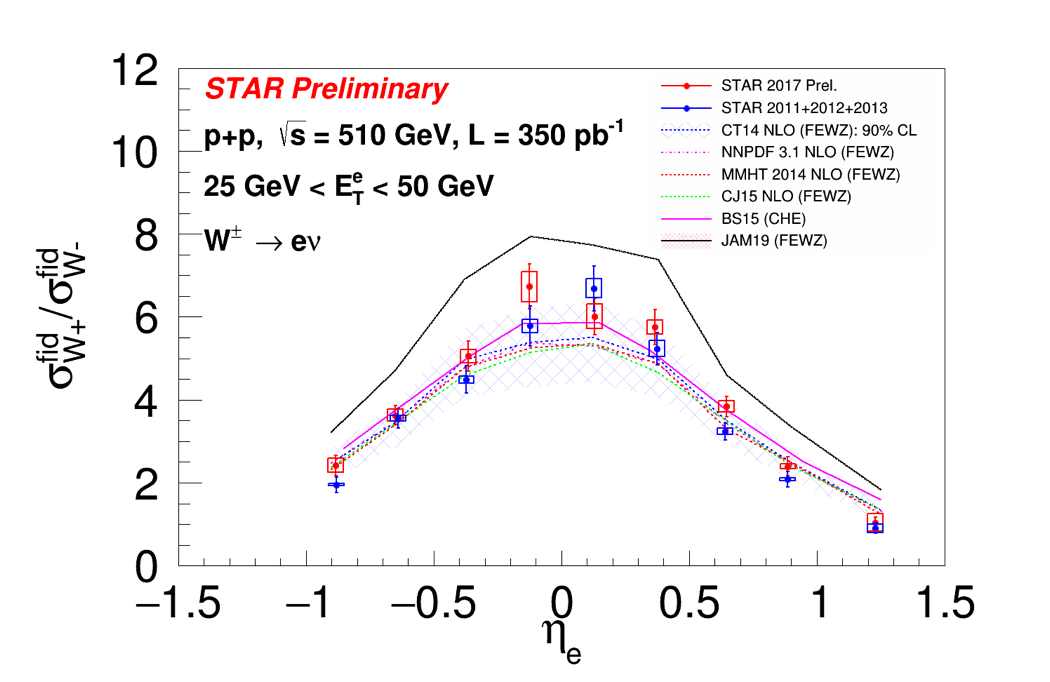
Figure 5: $R_{W}$ for STAR 2017 dataset against leptonic pseudorapidity in comparison to the published measurement using STAR 2011, 2012, and 2013 datasets. The central values correspond to the mean value of $\eta_{e}$ for that bin. The vertical bars represent the statistical uncertainty, whereas the height of the rectangles represents the systematic uncertainty for the respective data point. The measurement is compared to various theory frameworks with several PDF inputs.
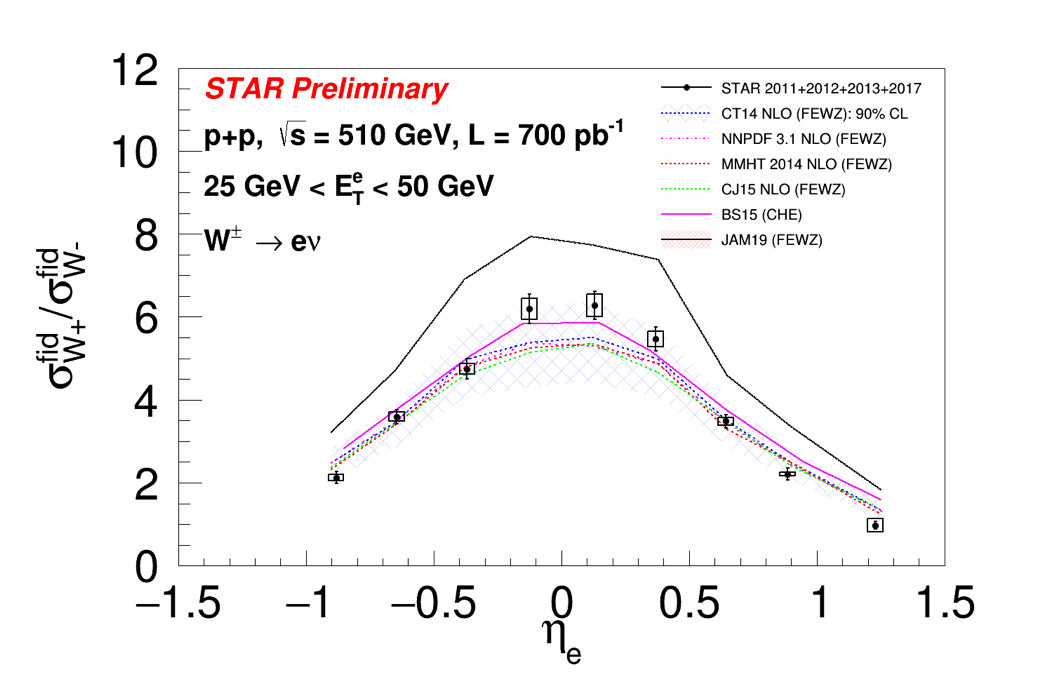
Figure 6: $R_{W}$ for combined STAR 2011, 2012, 2013 and 2017 datasets against leptonic pseudorapidity. The central values correspond to the mean value of $\eta_{e}$ for that bin. The vertical bars represent the statistical uncertainty, whereas the height of the rectangles represents the systematic uncertainty for the respective data point. The measurement is compared to various theory frameworks with several PDF inputs.
(PNG format)
(PDF format)
(EPS format)
Additional Materials
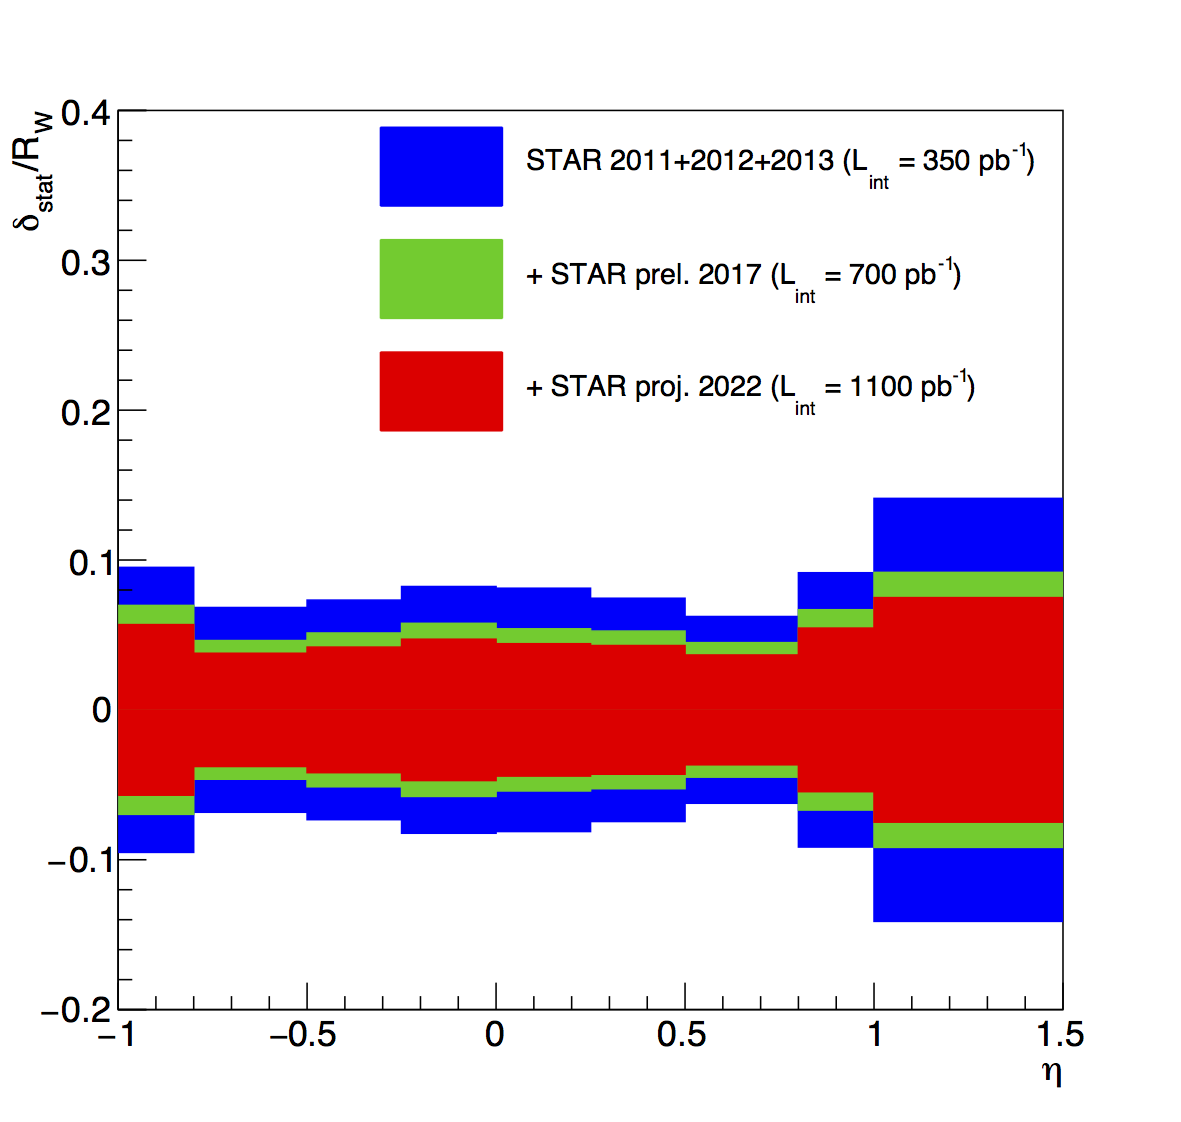
Projection for STAR Run 2022
Money plot with NNPDF 4.0 (includes SeaQuest)
PDF
- jaenam's blog
- Login or register to post comments