Hard pT weighting in MC
Here is the Comparison of event weighting of hard pT by using N_generated and N_tried.
The weighting for Lambda pT 3~4 GeV/c is used as the example.
The following table shows the weight comparison obtained from the number of generated and tried.
First, we calculate the absolutely weight(= xsection/nevents)
Then the relative weight to the lowest hard_pt bin is shown in the table.
| pt_hard | cross section | N_events | relative weight | W_generate / W_tried | ||
| generated | tried | generated | tried |
|
||
| 3~4 |
2.921E+00 |
402,982,359 |
1,751,444,204 |
1.000E+00 |
1.000E+00 |
1.00 |
| 4~5 |
7.084E-01 |
131,118,743 |
602,943,376 |
7.453E-01 |
7.044E-01 |
0.95 |
| 5~6 |
2.212E-01 |
54,106,666 |
231,196,237 |
5.639E-01 |
5.735E-01 |
1.02 |
| 6~8 |
1.159E-01 |
29,195,821 |
173,647,879 |
5.478E-01 |
4.003E-01 |
0.73 |
| 8~15 |
3.190E-02 |
9,606,555 |
52,954,659 |
4.581E-01 |
3.612E-01 |
0.79 |
| 15+ |
7.960E-04 |
3,524,413 |
21,956,043 |
3.115E-02 |
2.173E-02 |
0.70 |
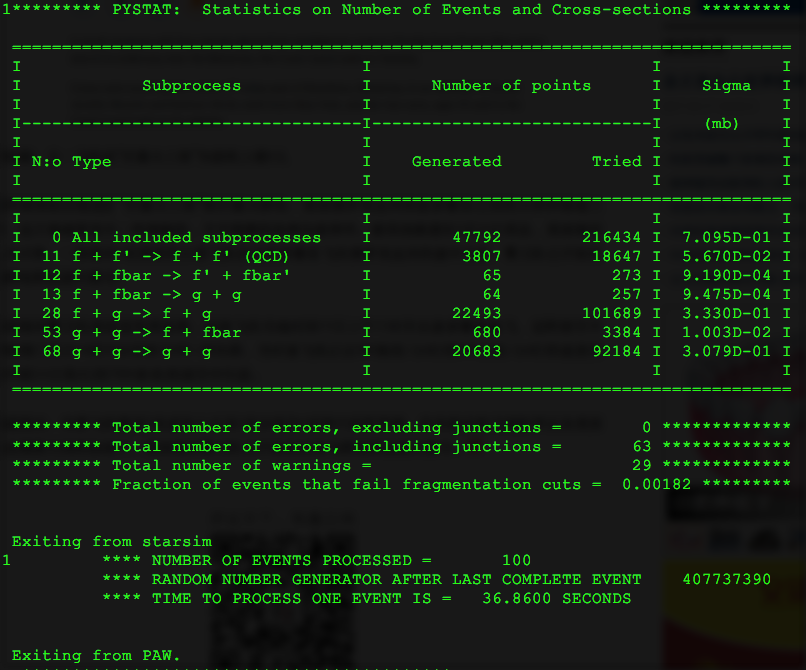
The source of numbers in the table is the log file:
This Statistics is shown the generation log file.
The numbers in the table are corresponding to the picture.
The row of NUMBER OF EVENTS PROCESSED = 100 is the number passed the Lambda filter and stored in the output file.
Details of the Lambda filter can be found:
https://drupal.star.bnl.gov/STAR/blog/jcmei/lambda-filter-used-mc-sample-production
The sum of number in the position of "47792" from each log file is the number of N_events of generated in the table.
The sum of number in the position of "216434" from each log file is the number of N_events of tried in the table.
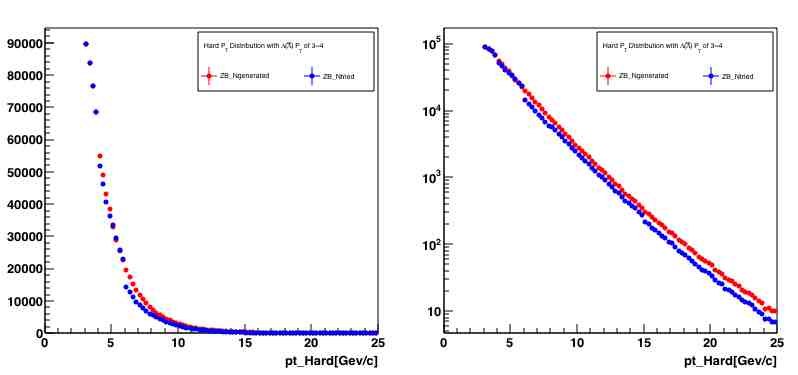
Then we did the testing with both of the two weights method.
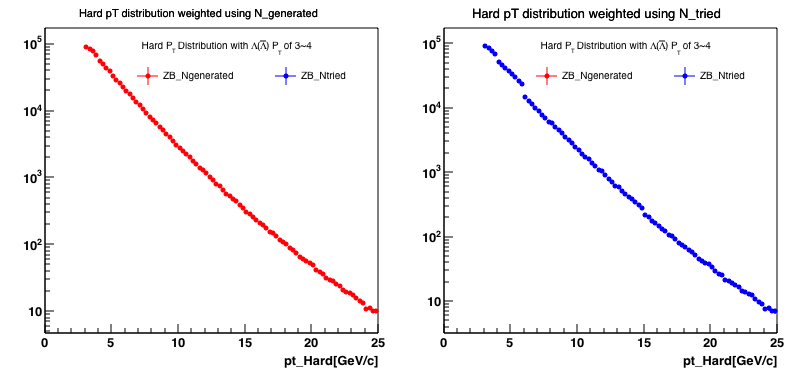
The comparison shows that the hard pT distribution weighed by the weight_generated is better the the weight_tried.
Here, the weight estimated using the number of events generated will be used.
- jcmei's blog
- Login or register to post comments