- jeromel's home page
- Posts
- 2025
- 2020
- 2019
- 2018
- 2017
- 2016
- 2015
- December (1)
- November (1)
- October (2)
- September (1)
- July (2)
- June (1)
- March (3)
- February (1)
- January (1)
- 2014
- 2013
- 2012
- 2011
- 2010
- December (2)
- November (1)
- October (4)
- August (3)
- July (3)
- June (2)
- May (1)
- April (4)
- March (1)
- February (1)
- January (2)
- 2009
- December (3)
- October (1)
- September (1)
- July (1)
- June (1)
- April (1)
- March (4)
- February (6)
- January (1)
- 2008
- My blog
- Post new blog entry
- All blogs
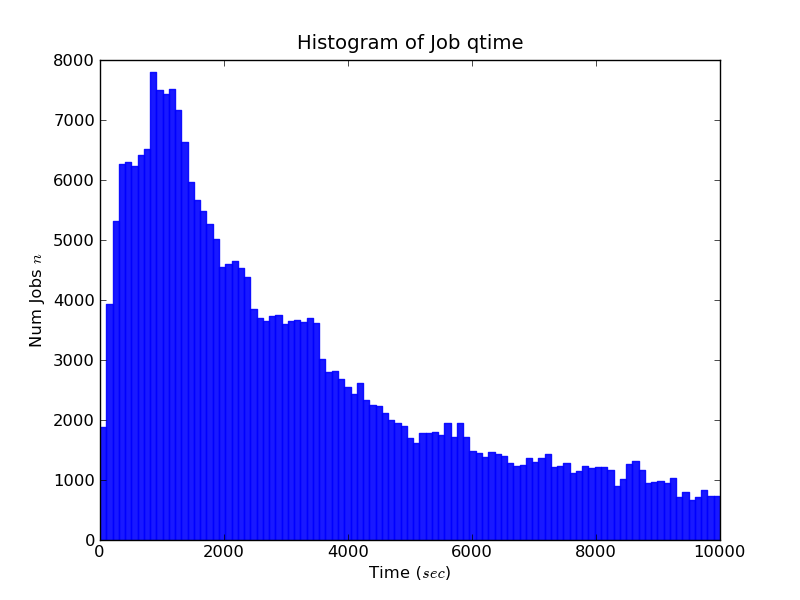
STAR jobs, time profile for users 2011/04
The following graphs is a zoom on the lower part of the distribution of job runtime for users. The graph is made ONLY with jobs completed with a success status. It represents a 2 weeks past statistics from April 1st 2011.
The peak at 1000 seconds (~ 17 mnts) for the shortest queue in STAR of ~ 2.5 hours (2 hours on the shared queue). Why this behavior and usage pattern?

Groups:
- jeromel's blog
- Login or register to post comments
