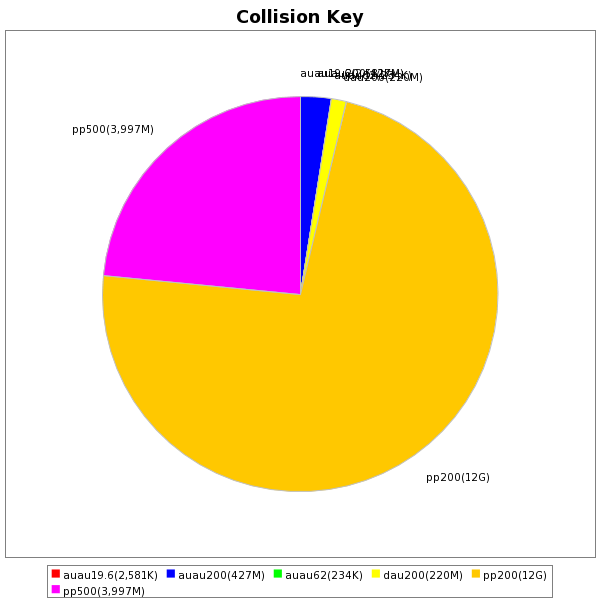
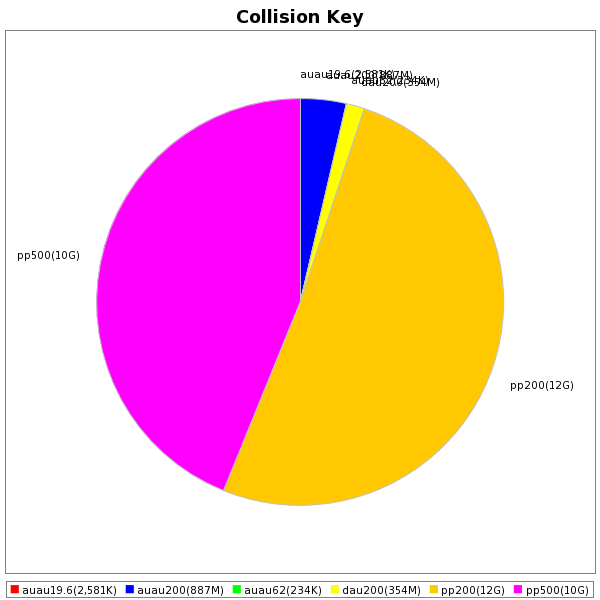
Popular datasets snapshot, August 2013
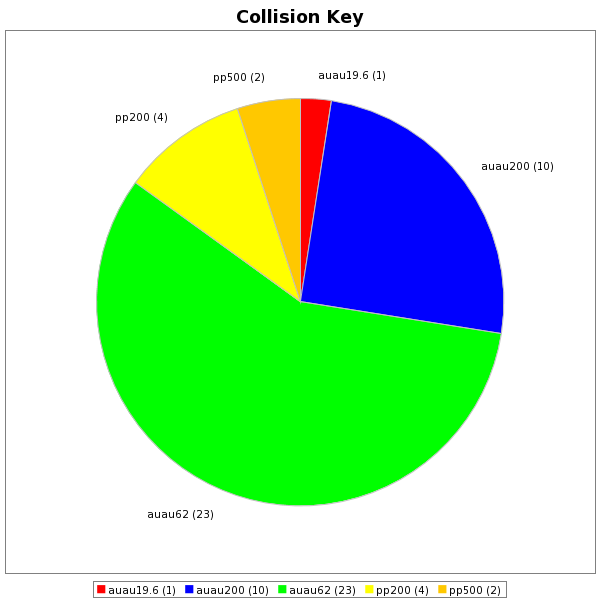
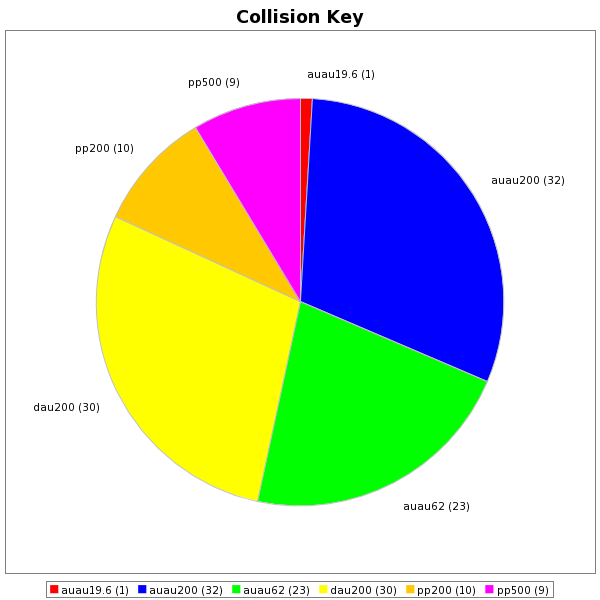
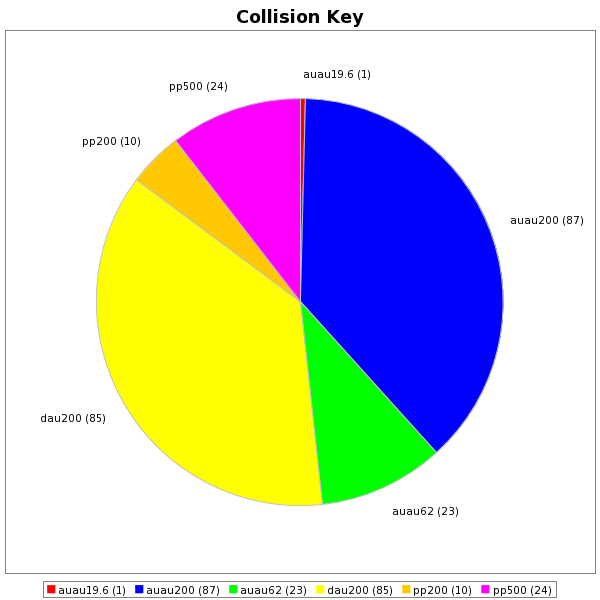
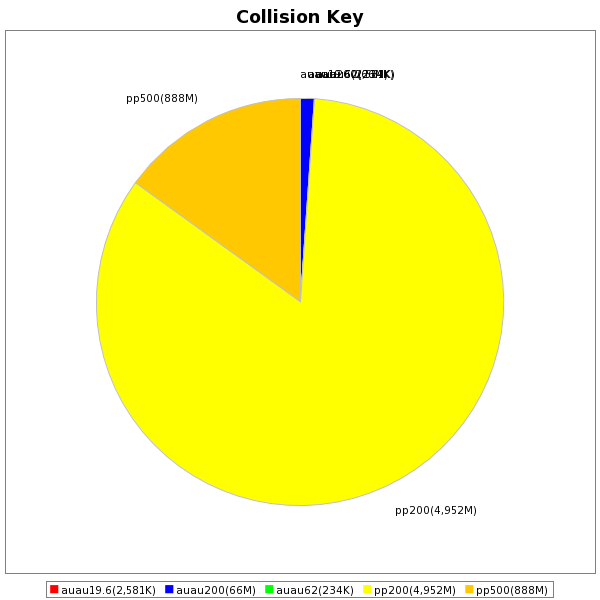
Here is a quick view of our user's really access from our datasets - the top row is by request and the bottom is renormalized by the number of events estimated as part of the request (if a dataset A is requested 10 times more than dataset B but dataset B has 10 times more event, the pie chart slices will be equal on the bottom graph but shows A 10 times bigger).
| Past month | Past 3 months | Past 6 months |
 |
 |
 |
 |
 |
 |
Groups:
- jeromel's blog
- Login or register to post comments