GPFS testing
Updated on Tue, 2013-12-31 07:45. Originally created by jeromel on 2013-12-27 10:46.
The expected sequential IP performance should be ~6GB/sec in writes and 7GB/sec in reads.
We are using RAID 6 (2+8), with 24 luns in all, 6 luns on each serve (4 servers). ach server is 20 Gb attached and there are 2x40 Gb lines from the Cisco Z9000 switch to the farm. The switch is shared by the HPSS traffic (so any IO saturation may slow down HPSS restore traffic).
GPFS was setup in replication mode 2. A note that the client handles writes and a replication 2 causes two writes (two copies handled by the client).
The test were done from rcas6010 on 2013/12/27.
While the writes are slow, the reads could saturate the NIC even with a simple dd command. One has to remember that in the current setup, the writes have to do x2 the IO (replication = 2). Hence, a write at 8.13 MB/sec is really doing 16+ MB/sec on the back-end.
In order to verify this, a new volume was mounted with replication=1 and the test performed again on 2013/12/30. The results follows:
The writes are not double but consistently on the increase while the reads remain as before.
benchmark tests
ioperf, single thread
The first set of tests were done with ioperf. The characteristics were:
They should be consistent with rates in dd/dsync mode but the fwrite() operation seem to be much lower (2.22 MB/sec against 6.37 MB/sec is a factor ~ 2.8 difference) consistent with the reads (33.09 MB/sec versus 113.11 MB/sec is ~ 3.4 difference).
The same test was repeated, one thread per processor was induced.
{results to add here}
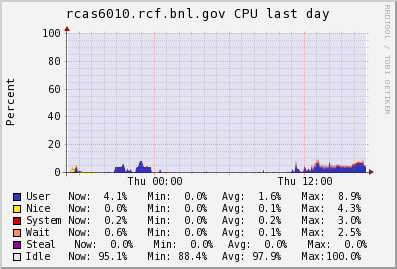
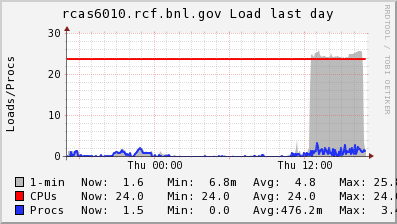
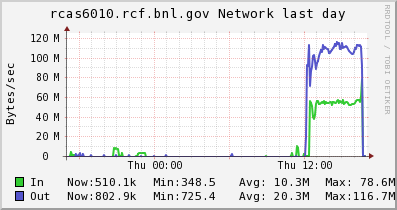
Because we alternate writes/reads/putc/getc/seek, the many threads in the background may not be all performing the same operations at the same time, making the overall aggregate number hard to interpret. However, we can see from the Ganglia graphs below that the threads were enough to saturate the network link.
With a 1 Gb/sec line (128 GB/sec maximum), we clearly saturated the IO at full blast during a multi-threaded IO tests.
The first attempt showed a network saturation to ~ 3.3 Gb/sec - this limitation is likely due to (a) the connectivity of the GPFS servers to he RHIC fabric (the servers were placed in the ATLAS computing room where there is space hence, we crossed networks) and (b) a typical LACP issue. There no point of showing much results here but we can show two sets of graphs and one number.
Here are the loads and activities from the 4 GPFS servers during this test
{plots to insert}
The total measured IO from the STAR/CAS nodes (one IO thread per node) was: {get aggregate}
2013/12/31 Test
The fabric was reshaped (network connections were made directely the RHIC switches from the GPFS servers). The multi node test was done again. First, let us look at the graphs from the GPFS server side.
General
This page will summarize the initial testing of GPFS at BNL.2013/12 test setup
The system deployed has 240 x 4TB) drives for a total space of near a PByte. Those are SATA drives (7.2kRPM).The expected sequential IP performance should be ~6GB/sec in writes and 7GB/sec in reads.
We are using RAID 6 (2+8), with 24 luns in all, 6 luns on each serve (4 servers). ach server is 20 Gb attached and there are 2x40 Gb lines from the Cisco Z9000 switch to the farm. The switch is shared by the HPSS traffic (so any IO saturation may slow down HPSS restore traffic).
GPFS was setup in replication mode 2. A note that the client handles writes and a replication 2 causes two writes (two copies handled by the client).
Single node test and general observations
Observations
- An IO test from node A, aborted by kill -9, leaded to left over files as expected. What was not expected is that a delete of those files from node B leaded to an access protection message.
#2 Creating files from node A, I could not delete from node B
Note: This should be redone with a sync command in between. As simialr IO test (aborted with CRTl/C and leaving files over) done on 2013/12/30 did not lead to an access denied upon deletion from another node. This may not happen all the time but under certain conditions.
% rm /gpfs/scratch/_rcas6009r__gpfs_scratch.html
rm: remove write-protected regular empty file `/gpfs/scratch/_rcas6009r__gpfs_scratch.html'? y
rm: cannot remove `/gpfs/scratch/_rcas6009r__gpfs_scratch.html': Permission denied
- Another observation is that while IO is performed, an "ls" is very very slow ... The IO test was reshaped to use a deep directory structure. The result of a "ls" command (while IO test are ongoing) is as follows:
% time ls -alrt /gpfs/scratch/
total 1280
[...]
0.001u 0.001s 0:14.03 0.0%      0+0k 0+8io 0pf+0w

% time ls -alrt /gpfs/scratch/starlib/
[...]
0.002u 0.017s 13:01.40 0.0%     0+0k 0+0io 0pf+0w
This is known issue with GPFS. It is worth noting the IO is NOT being performed in /gpfs/scratch/starlib/ but one directory deeper than that.
- ...
Performance
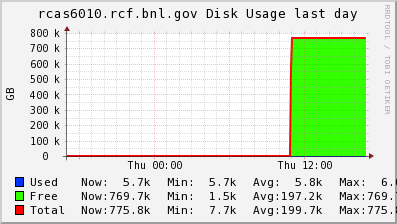
From a single node, the IO was limited by the client NIC speed as showed on the graphs below.The test were done from rcas6010 on 2013/12/27.
dd test
An initial dd test was performed as a base number for comparisondd if=/dev/zero of=/gpfs/scratch/test$i.out bs=64k count=[n] oflag=[x]The above was done with the direct and dsync option over 10 tries (to determine an error bar). The files were read back and directed to /dev/null. Summarizing the results:
| writes (direct) | 8.13 +/- 0.48 MB/sec |
| writes (dsync) | 6.37 +/- 0.58 MB/sec |
| reads | 113.11 +/- 2.26 MB/sec |
While the writes are slow, the reads could saturate the NIC even with a simple dd command. One has to remember that in the current setup, the writes have to do x2 the IO (replication = 2). Hence, a write at 8.13 MB/sec is really doing 16+ MB/sec on the back-end.
In order to verify this, a new volume was mounted with replication=1 and the test performed again on 2013/12/30. The results follows:
| writes (direct) | 13.37 +/- 0.62 MB/sec |
| writes (dsync) | 9.77 +/- 0.47 MB/sec |
| reads | 105.71 +/- 4.07 MB/sec |
The writes are not double but consistently on the increase while the reads remain as before.
benchmark tests
ioperf, single thread
The first set of tests were done with ioperf. The characteristics were:
- Block IO is performed - a block is a sizeof a double (8 bytes on our systems)
- A block size is 8192 - the total bytes is then 65536 i.e. 64 kBytes per block operations (this is similar to the dd above)
- 10,000 blocks are tried per pass - each pass creates a file, the file size is hence 625 MB
- 1,000 seeks (of the same block size) are made after a file has been written
- The test is repeated 25 times and an average computed
| KBytes/sec | MB/sec | |
| fwrite | 2271.94 | 2.22 |
| fread | 33879.88 | 33.09 |
| putc | 2255.82 | 2.20 |
| getc | 3879.49 | 3.79 |
| seek | 1380.44 | 1.35 |
They should be consistent with rates in dd/dsync mode but the fwrite() operation seem to be much lower (2.22 MB/sec against 6.37 MB/sec is a factor ~ 2.8 difference) consistent with the reads (33.09 MB/sec versus 113.11 MB/sec is ~ 3.4 difference).
The same test was repeated, one thread per processor was induced.
{results to add here}
Because we alternate writes/reads/putc/getc/seek, the many threads in the background may not be all performing the same operations at the same time, making the overall aggregate number hard to interpret. However, we can see from the Ganglia graphs below that the threads were enough to saturate the network link.
 |
 |
 |
 |
With a 1 Gb/sec line (128 GB/sec maximum), we clearly saturated the IO at full blast during a multi-threaded IO tests.
Multiple node test
The tests were perforrmed using ioperf (same basic conditions as single node test as expained above).The first attempt showed a network saturation to ~ 3.3 Gb/sec - this limitation is likely due to (a) the connectivity of the GPFS servers to he RHIC fabric (the servers were placed in the ATLAS computing room where there is space hence, we crossed networks) and (b) a typical LACP issue. There no point of showing much results here but we can show two sets of graphs and one number.
Here are the loads and activities from the 4 GPFS servers during this test
{plots to insert}
The total measured IO from the STAR/CAS nodes (one IO thread per node) was: {get aggregate}
2013/12/31 Test
The fabric was reshaped (network connections were made directely the RHIC switches from the GPFS servers). The multi node test was done again. First, let us look at the graphs from the GPFS server side.
»
- jeromel's blog
- Login or register to post comments