- jeromel's home page
- Posts
- 2025
- 2020
- 2019
- 2018
- 2017
- 2016
- 2015
- December (1)
- November (1)
- October (2)
- September (1)
- July (2)
- June (1)
- March (3)
- February (1)
- January (1)
- 2014
- 2013
- 2012
- 2011
- 2010
- December (2)
- November (1)
- October (4)
- August (3)
- July (3)
- June (2)
- May (1)
- April (4)
- March (1)
- February (1)
- January (2)
- 2009
- December (3)
- October (1)
- September (1)
- July (1)
- June (1)
- April (1)
- March (4)
- February (6)
- January (1)
- 2008
- My blog
- Post new blog entry
- All blogs
HPSS MDC, Run 16
Updated on Wed, 2016-04-20 09:20 by testadmin. Originally created by jeromel on 2015-12-30 10:51.
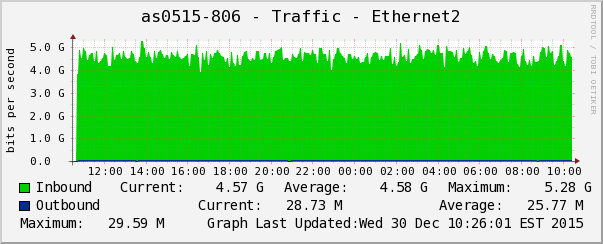
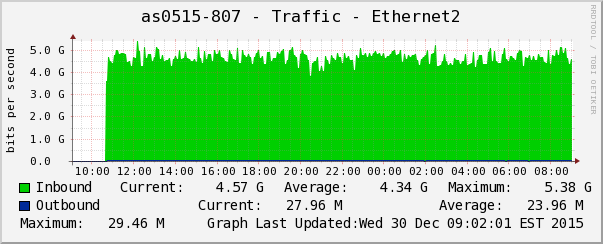
After an HPSS cache reshape and upgrade of the tape drive micro-code, we decided to proceed with a new MDC before Run 16. Below are the graphs / results of this MDC. Overall, all systems are A-OK and it looks pretty good and we are not constrained on the HPSS side (since the speed is essentially reaching a network saturation assuming a 2x10 Gb line - see notes below).
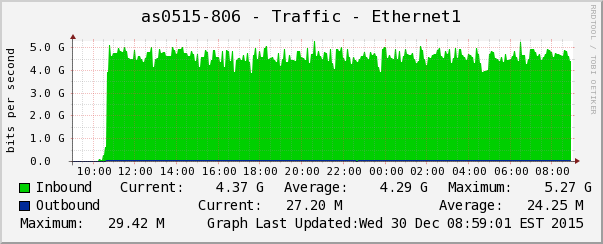
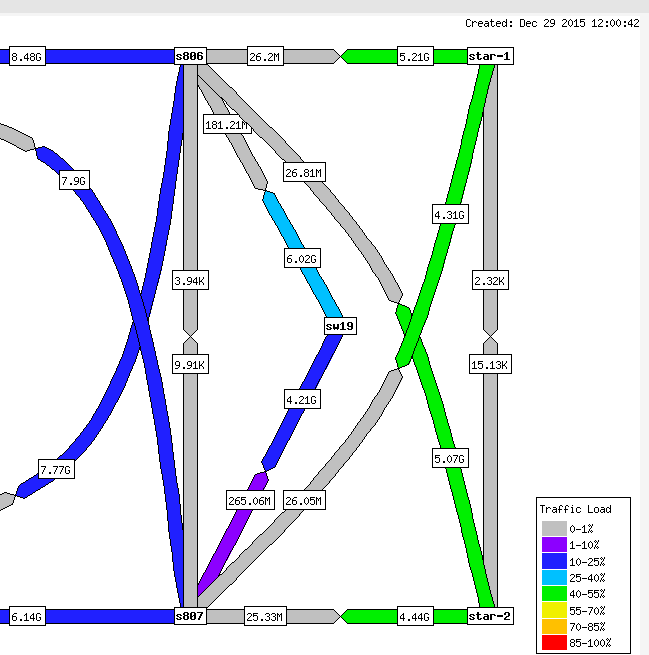
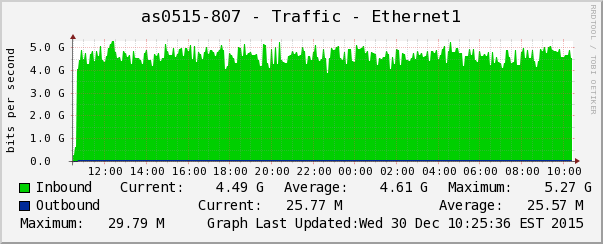
Overall, the network active-active multi-path is well balanced and performing well.All links shows similar performance over long period of times.
A note that the sum of all links would give 4.60+4.65+4.63+4.57=18.45 Gb/sec ~ 2.3 GB/sec.
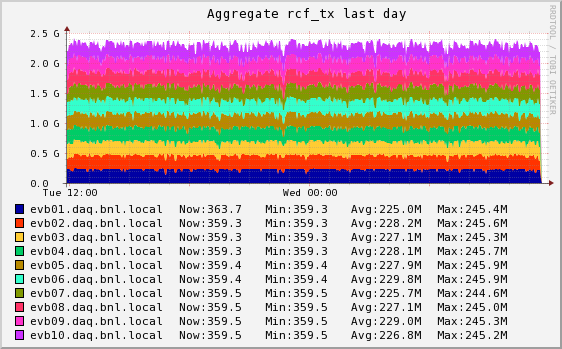
The view from the STAR online/Ganglia plot would show the following and is not inconsistent with the avlue measured above.
After an HPSS cache reshape and upgrade of the tape drive micro-code, we decided to proceed with a new MDC before Run 16. Below are the graphs / results of this MDC. Overall, all systems are A-OK and it looks pretty good and we are not constrained on the HPSS side (since the speed is essentially reaching a network saturation assuming a 2x10 Gb line - see notes below).
Transfer monitoring through the diverse network paths
Overall, the network active-active multi-path is well balanced and performing well.All links shows similar performance over long period of times.
 |
|
 |
  |
 |
A note that the sum of all links would give 4.60+4.65+4.63+4.57=18.45 Gb/sec ~ 2.3 GB/sec.
The view from the STAR online/Ganglia plot would show the following and is not inconsistent with the avlue measured above.

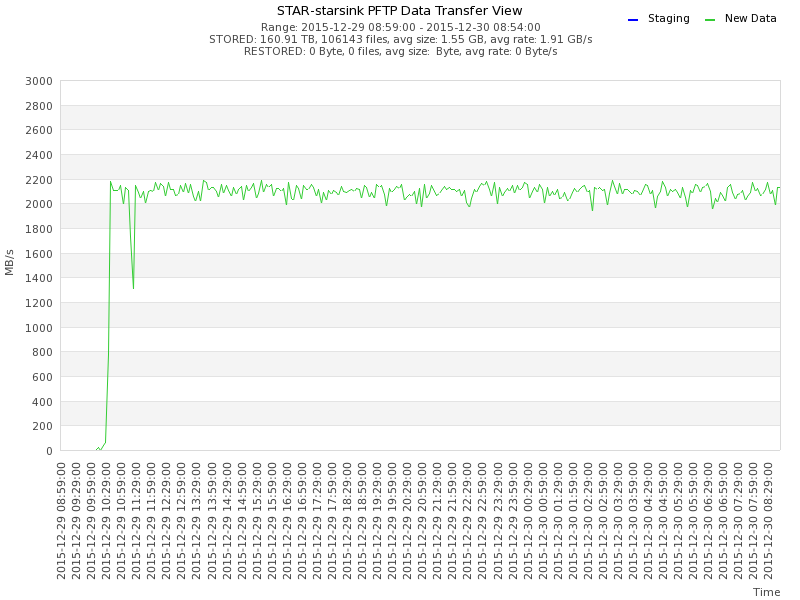
pftp and cache write performances
THe two below graphs are from different viewpoint.| Only starsink transfers isolated/monitored. 2.1 GB/sec seen over long period of times (consistent within error of what we measure as network traffic) |
 |
| All tansfers cumulative in and out split (merged view, all pftp traffic monitored). The restores are from production and the DataCarousel (mostly production). Transfer in includes starsink + starreco production files. Over large time periods, the transfers in are stable. |
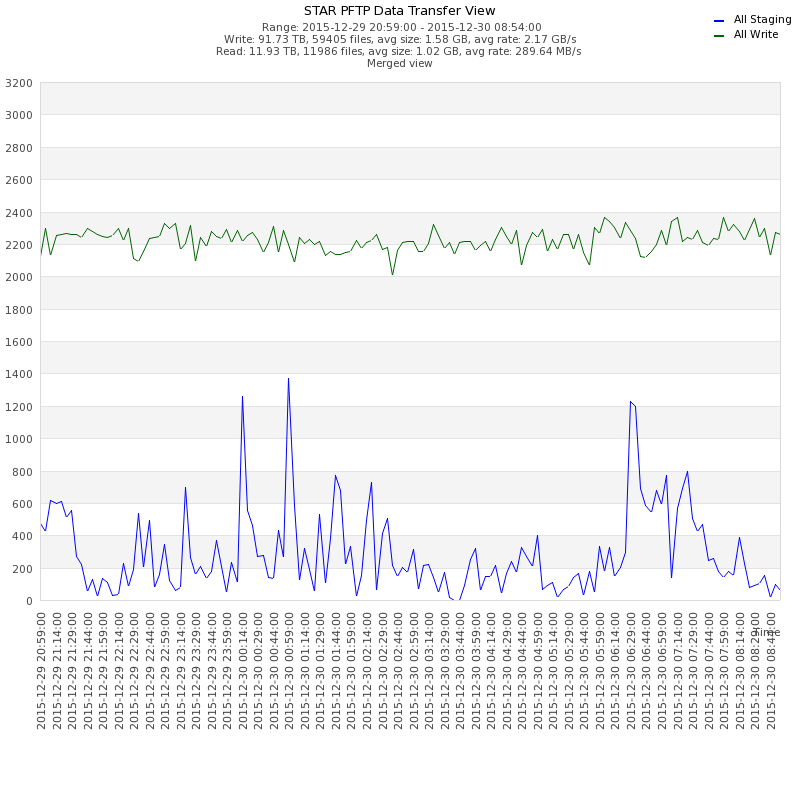 |
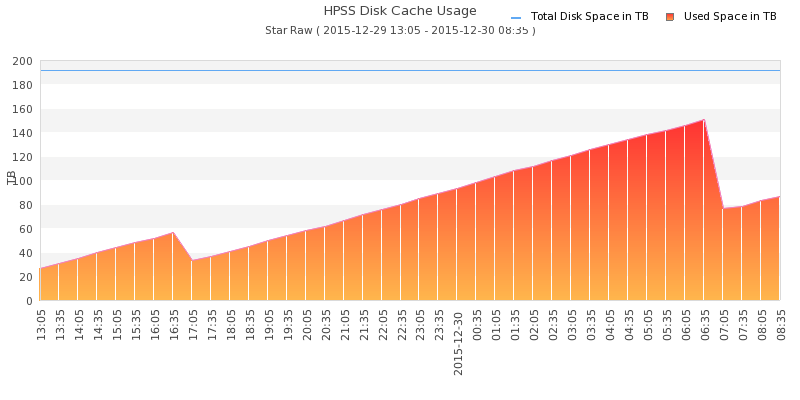
| HPSS cache purge cycle Around 6:35 AM on 2015/12/30, HPSS normal cycle purged the cache (Water-marking based rule) - during this process, data production was not negatively affected (there was no change in the farm's saturation). |
 |
Notes
We currently have 4 disk movers at 2x10GbE each for a total of 80 GbE. Network connectivity between CH and HPSS 4x10GbE but with redundancy. Optimistically, the disk cache is good for 6 GB/sec sustained to disk if there is no other activity BUT- the sustained rate of 6 GB/sec can only be acieved as far as there is space on the disk cache - Migration to tape is tape drive limited at say around 2GB/sec at best. Hence, the expected mix-activity data sinc speed would be reduced to 4 GB/sec (although we have never pushed and tested this particular saturation and mixed activity)
- staging for production or retreival of other data STAR data by users will compete with bandwidth and IO performance. We have already noted that usr's can impact data production at 30% levels (see December 2015) and would equally direly affect data syncing due to exclusive tape access. Assuming the Carousel is used, the expcted impact is ~ 20%.
»
- jeromel's blog
- Login or register to post comments
