FMS simulation (cont.)
This is a page showing the effort of QA for the trigger simulation before a mass production of simulated Pythia events with real trigger condition.
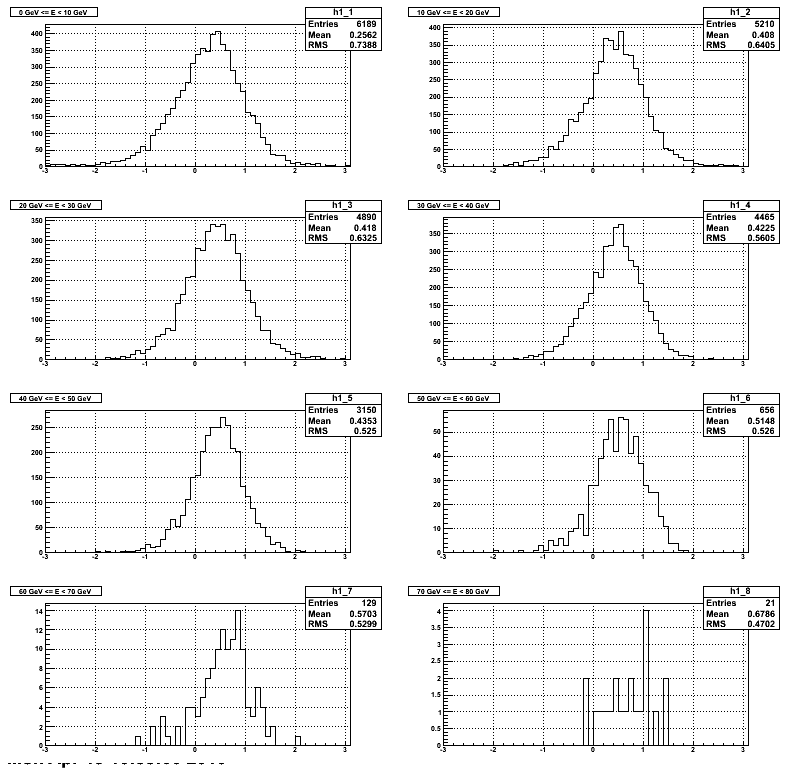
First, just to clarify the incident angle effect because I saw the difference between X_recon-X_sim and Y_recon-Y_sim for photon in the small cells. People have suggested that it's due to the fact that more events are coming from the horizontal part of the detector. And indeed it's the trueth. The following plots shows that by selecting photons specifically from the horizontal and vertical regions of the detector, the incident angle effect is obvious.
Fig. 1 X_recon-X_sim distribution in the horizontal region (8 < y < 16)
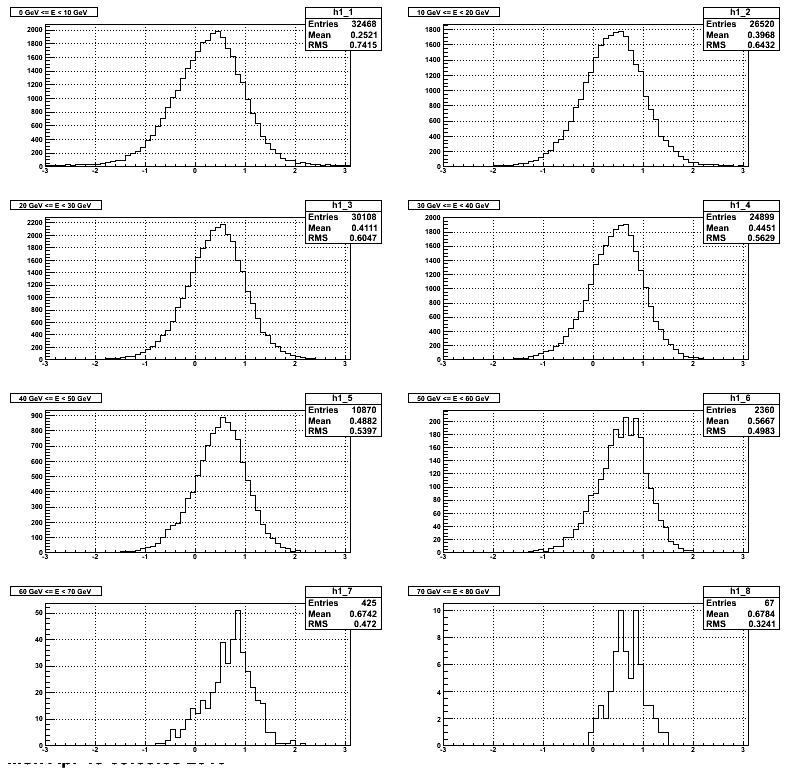
Fig. 2 Y_recon-Y_sim distribution in the horizontal region (8 < y < 16)
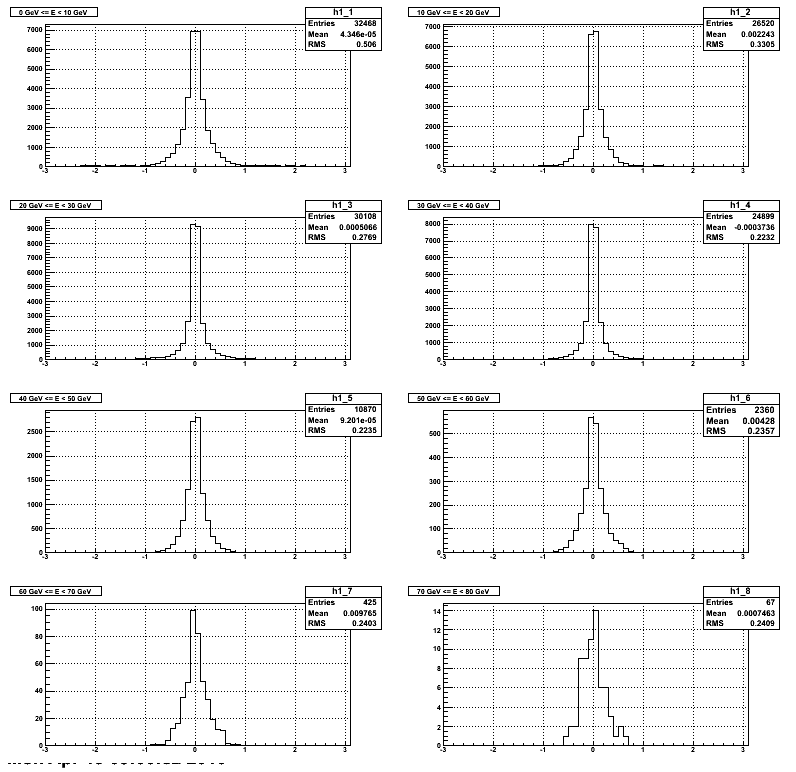
Fig. 3 X_recon-X_sim distribution in the vertical region (x < 4)
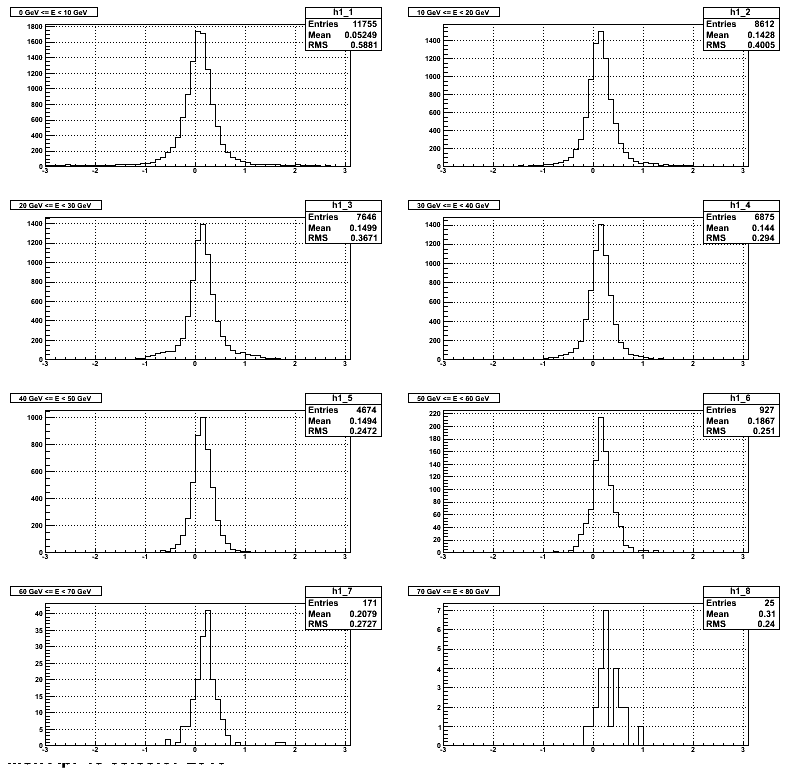
Fig. 4 Y_recon-Y_sim distribution in the top vertical region (x < 4 && y < 12)
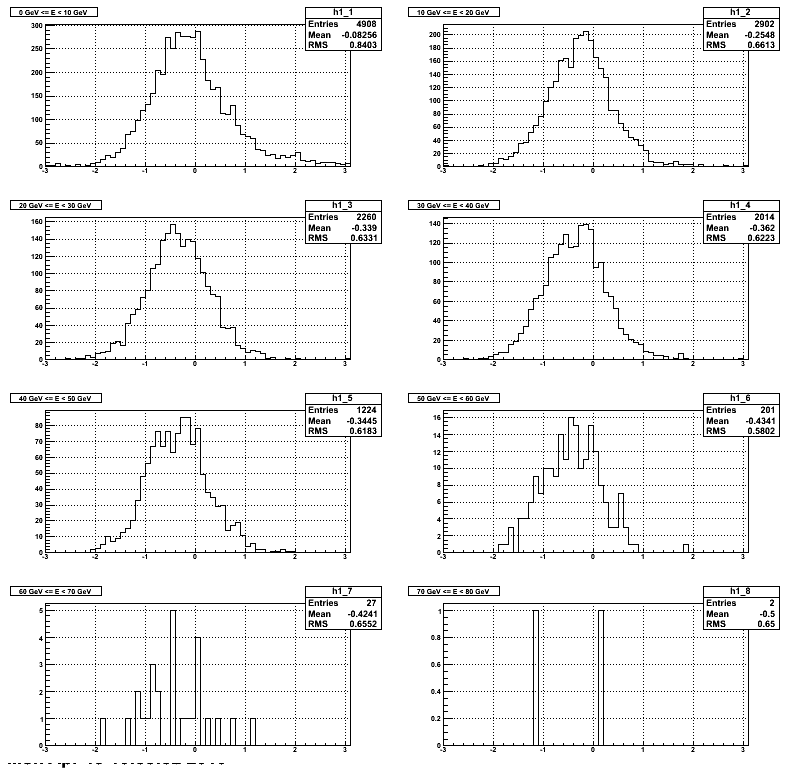
Fig. 5 Y_recon-Y_sim distribution in the bottom vertical region (x < 4 && y > 12)
The trigger algorithm has been modified a few more times to match with the real data. Right now, based on real qt data, the trigger algorithm can replicate all L0, L1 and L2 DSM data. This is based on about 1700 data files and ~8 M events (day 179, run 10179006-10179060)! There are only 7 events with mismatch at the qt level (so it's not a trigger algorithm problem).
Fig. 6 Cluster sum trigger distributions for small cells with norminal gains. There are some features of the distribution:
1. One striking feature is that the trigger is concentrated in the central horizontal and vertical regions.
2. It's not symmetric between horizontal and vertical direction, may be due to the seperation between north and south detector (1.86 cm for small cells).
3. Top region of the figure has much lower trigger rate, which is not understood yet.
.gif)
Fig. 7 Cluster sum trigger distributions for large cells with norminal gains. Most triggers are from the central horizontal region.
.gif)
Fig. 8 Cluster sum trigger distributions in small cells for real data. I think the real data shows the same general feature as simulation although there are variations because of the variations in gain factors. Note that the "hot" cell at (x=0, y=2) looks like a mapping error, as Steve has suspected (that there might be mapping errors in that region).
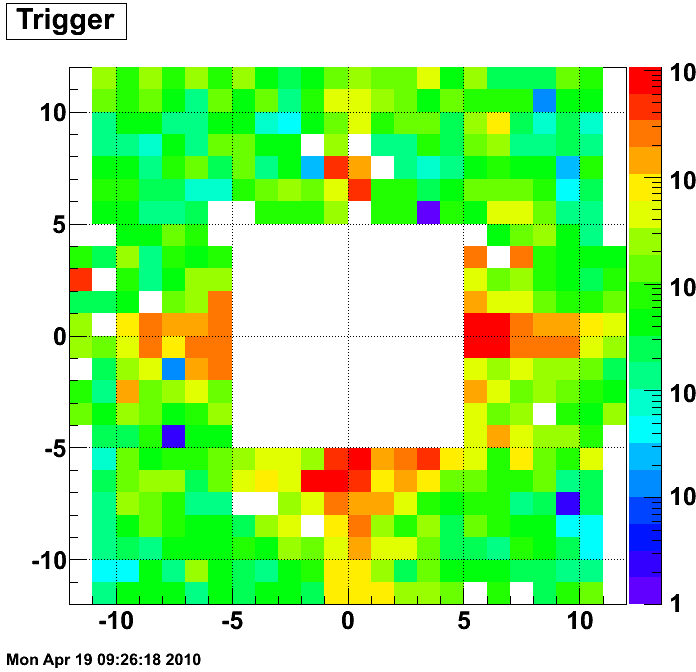
Fig. 9 Cluster sum trigger distributions in large cells for real data.
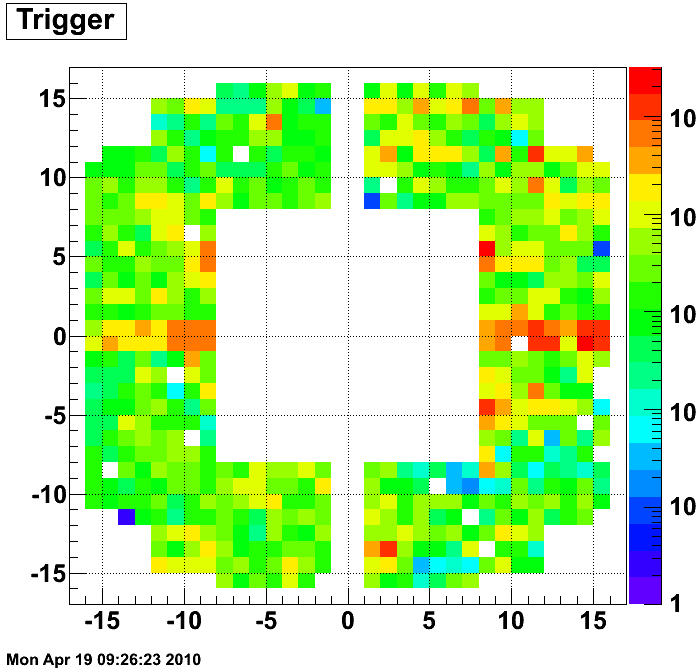
Fig. 10 Simulated cluster sum trigger distributions in small cells with gain factors on 03262010.
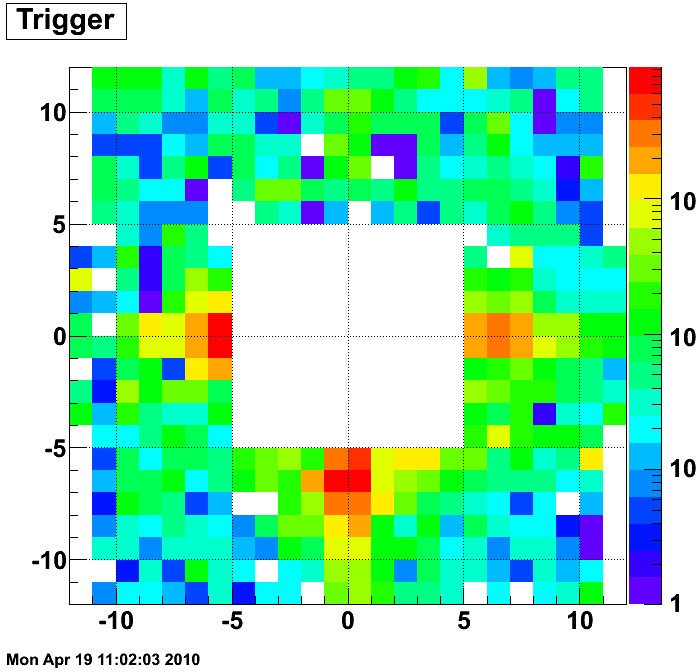
Fig. 11 Current gain factors.
.gif)
Fig. 12 This is the ratio of trigger rate in real data to that of simulation.
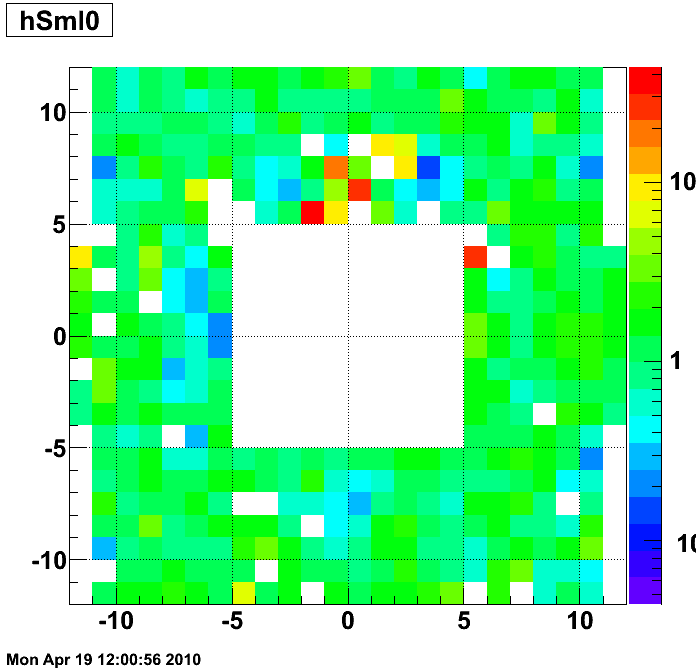
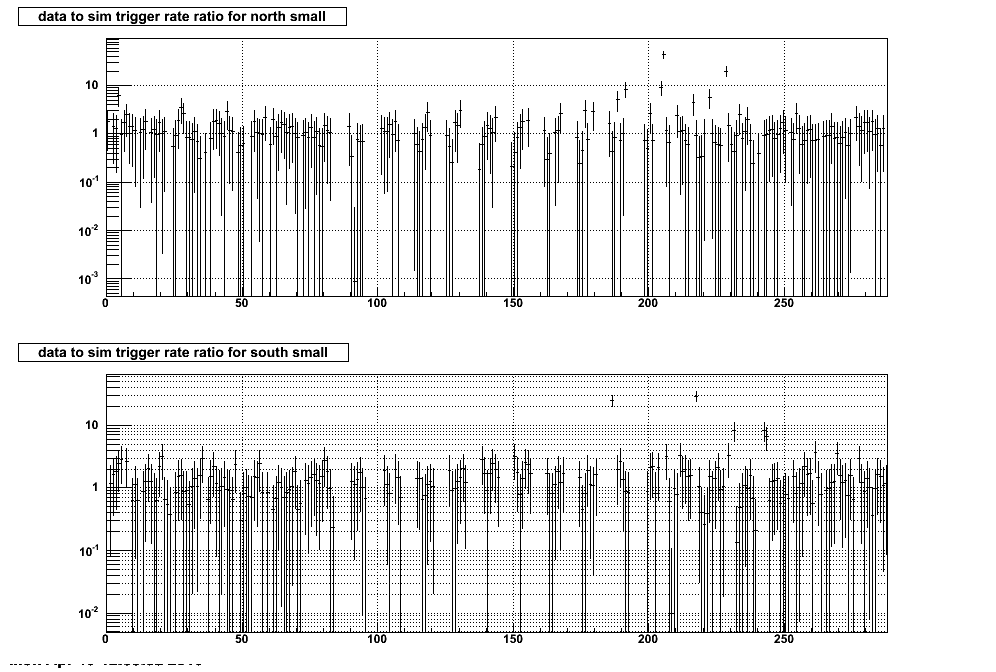
Fig. 13. This is the same distribution in one dimentional histogram as a function of detector channel number. The numbers of entries are used for normalization.
- jgma's blog
- Login or register to post comments
