Trigger rate w/o dead cells
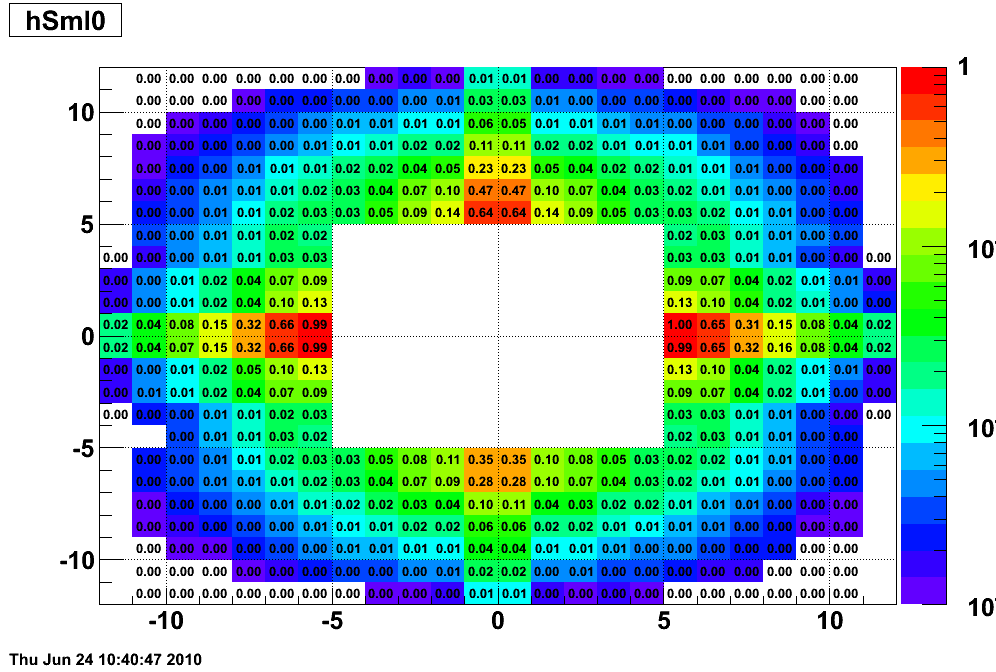
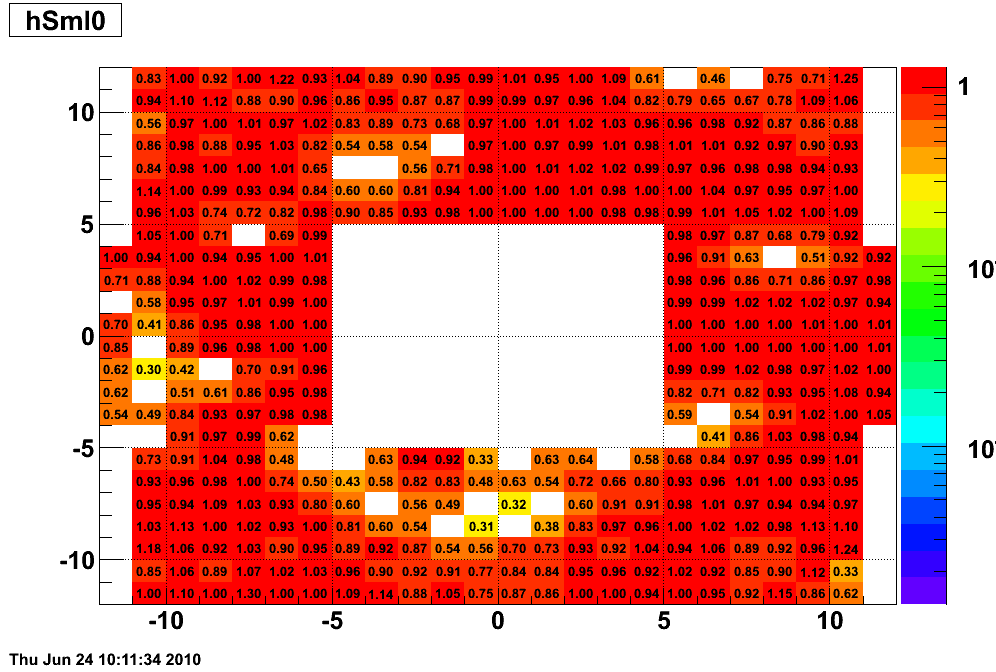
This is to demonstrate the trigger rate distribution from norminal gains and dead cell effect.
Fig. 1. Cluster trigger rate distribution with norminal gain (based on thresholds on run9 day 179). The rate is normalized by the maximum rate in the small detector. General feature is that the trigger rate in the center vertical region is about 65% of that in the center horizontal region due to the seperation of the north and south detector. And the trigger rate in the bottom part of the detector is only 35% of the center horizontal region due additionally to the materials infront of the FMS.

Fig. 2. The change in the trigger rate for each cell when dead cells are considered. Generally, one dead cell can cause the trigger rate of surounding cells to decrease by 40% to 60% and the decrease is even more when there are multiple dead cells in the region (for example the bottom region of small cells.).

The above plots were discussed in last week's FMS extra meeting (6/25). As Carl pointed out that the trigger rate in the central horizontal and vertical region seems to be two high and it may be from multi-cluster trigger which has much lower threshold. After checking my code, I confirmed this. What happened is that in the simulation, I filled the high tower address if either single cluster trigger (with the higher second threshold) or multi-cluster trigger (with the lower first threshold) bits are on. Now the following plots are for single cluster trigger bits on only (of course there are still (very little) multi-cluster triggered events, but these clusters are all above the second trigger threshold thus they satisfy the single cluster trigger condition).
Fig. 3. Updated distribution of Fig.1
.gif)
Fig. 4. Updated distribution of Fig.2
.gif)
- jgma's blog
- Login or register to post comments
