FMS trigger simulation
Simulation is done on the trigger based on 30 M minimus-bias Pythia 6.222 + GSTAR events. In the simulation, adc values for each cell of the FMS are calculated by Steve's latest gain and gain correction factors and then the data is encoded into QTdata in the same way as the real data. Trigger bits are generated according to Eleanor's run9 trigger algorithm document http://www.star.bnl.gov/public/trg/run2009/fms_algorithm.pdf.
Fig. 1 This is the gain correction factors provided by Steve on 2/22/2010. These are not final as Steve's continuing working on it.
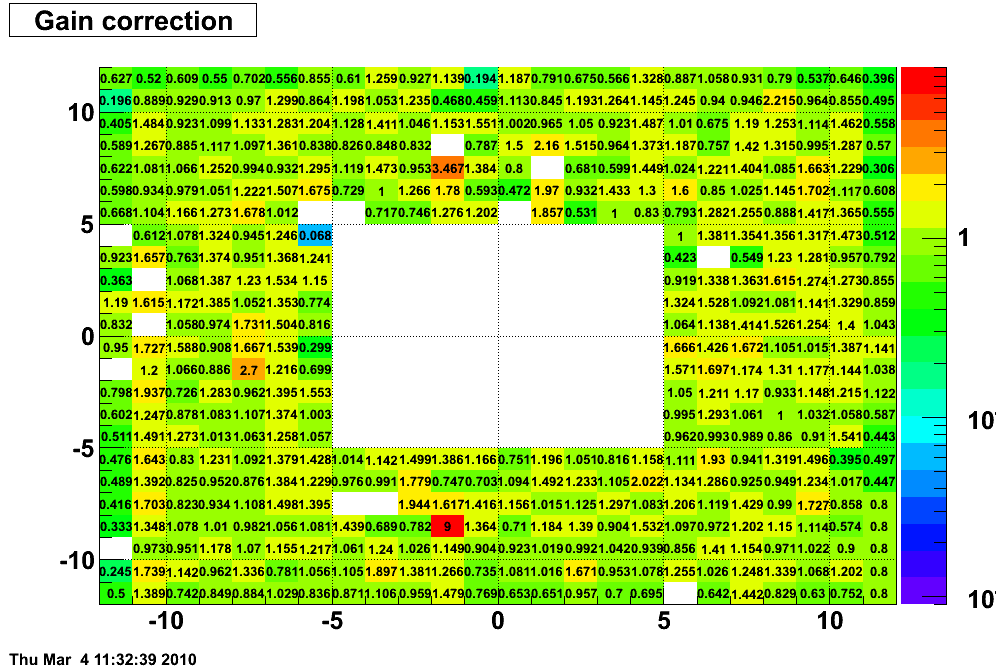
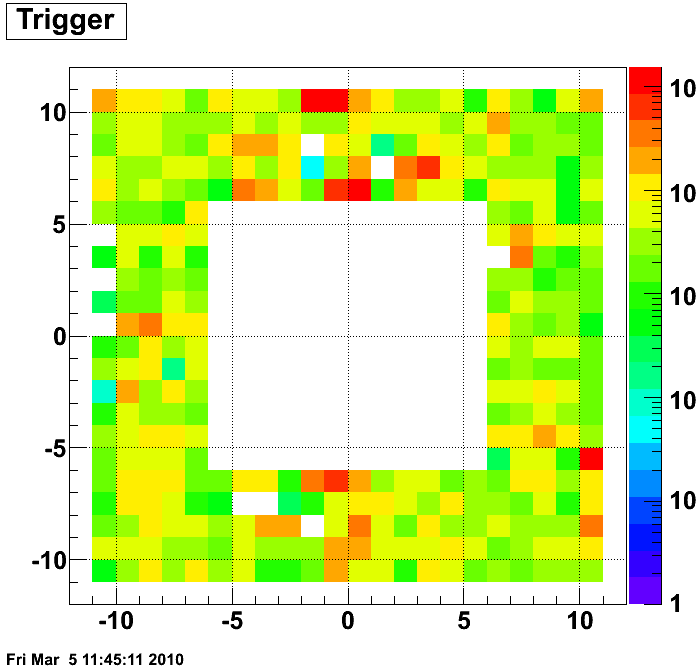
Fig. 2. Distribution of the highest tower position in triggered cluster trigger with threshold 1 for the small cells. This plot is to be compared with real data http://drupal.star.bnl.gov/STAR/blog/leun/2009/jun/16/run10166026. The general trend agrees, but details differ.
The following document by Steve (page 9) shows the adc bit shift which hasn't yet been implemented in the trigger simulation. http://drupal.star.bnl.gov/STAR/files/userfiles/1651/file/Transverse.pdf
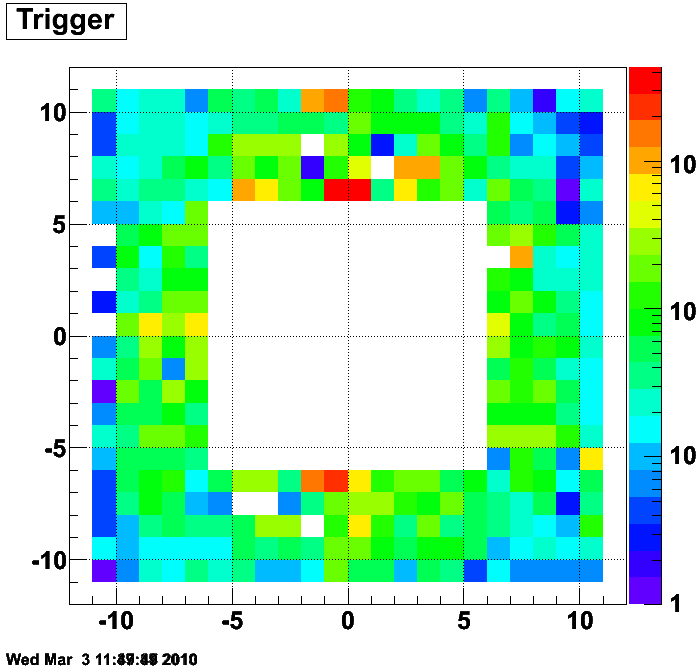
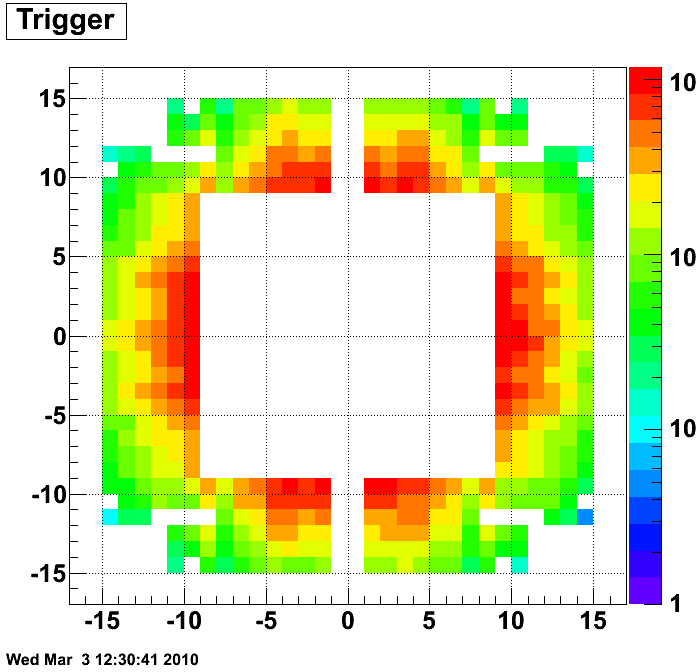
Fig. 3. Distribution of the highest tower position in triggered cluster trigger with threshold 1 for the large cells. Currently the large cell gains are just constant, as can be seen by the trigger rate falls with rapidity.
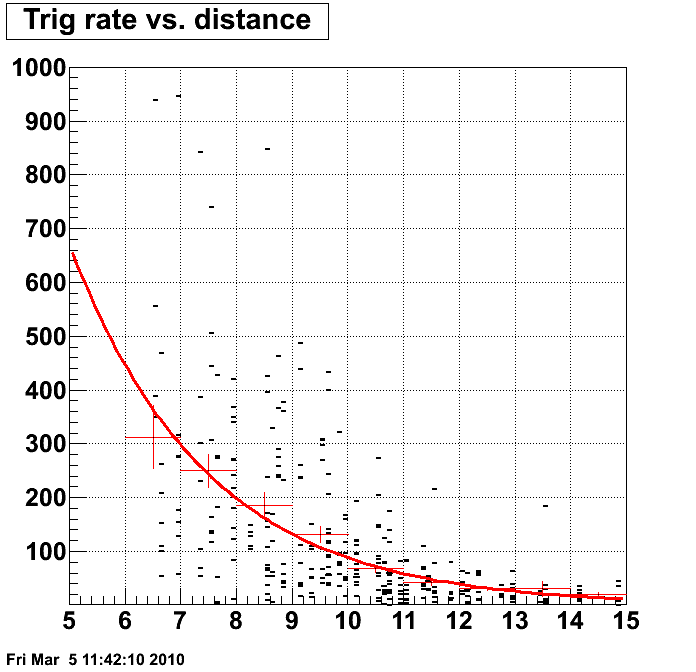
Because of the acceptance of the detector, inner cells are more likely to give a trigger. Fig. 4. shows the dependence of trigger rate on the distance to the beam, where red crosses are the profile of the distribution and red line is a fit to the profile. There is clearly a distance (or eta) dependence, the closer to the beam, the higher the trigger rate.
Fig. 4. Distance (eta) dependence of the trigger rate.
If we apply a distance correction to the trigger rate, we can look at the dependence of the trigger rate on the gain correction factor. Fig. 5 shows the trigger rate distribution after the correction on the distance to the beam. After the correction, the clear distance (eta) dependence of the trigger rate is gone.
Fig. 5 Trigger rate distribution.
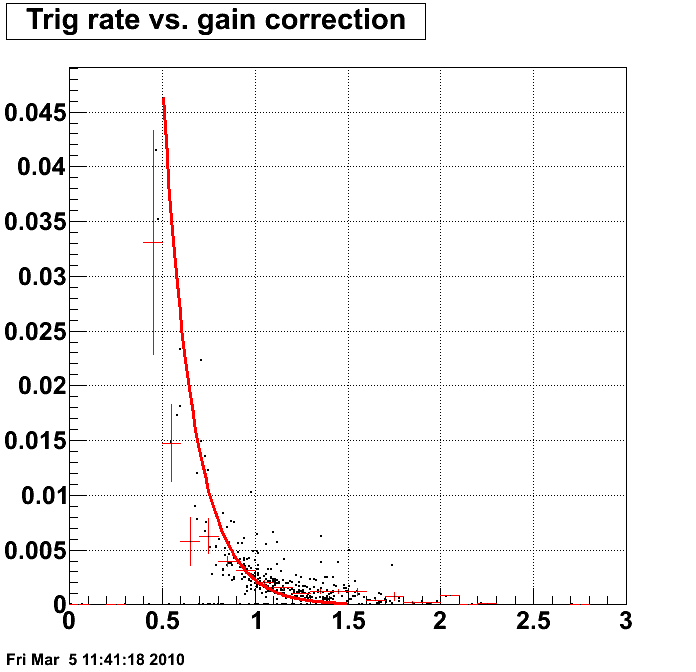
Now we can look at the gain correction factor dependence of the trigger rate, which is shown in fig. 6. Clearly the trigger rate decreases with higher gain correction factor, but the relationship is spersed due to the fact that all cells are correlated in trigger.
Fig. 6.
- jgma's blog
- Login or register to post comments
