FMS run9 calibration
Here is a progress report on the calibration for FMS small cells in run 9. Normally, cell-by-cell gain calibration has been done based on the reconstructed Pi0 mass. This method encountered difficulties for the FMS (as we can see there is a large energy dependent of reconstructed Pi0 mass) due to various reasons: large gain variations among cells, dead cells etc.
We are attempting to use more information than just Pi0 mass in the calibration process. Steve's added a factor connected to the high-energy (~65 GeV) Pi0 cross-section in each cell. Here I'm trying to add a factor related to the trigger rate of each cell.
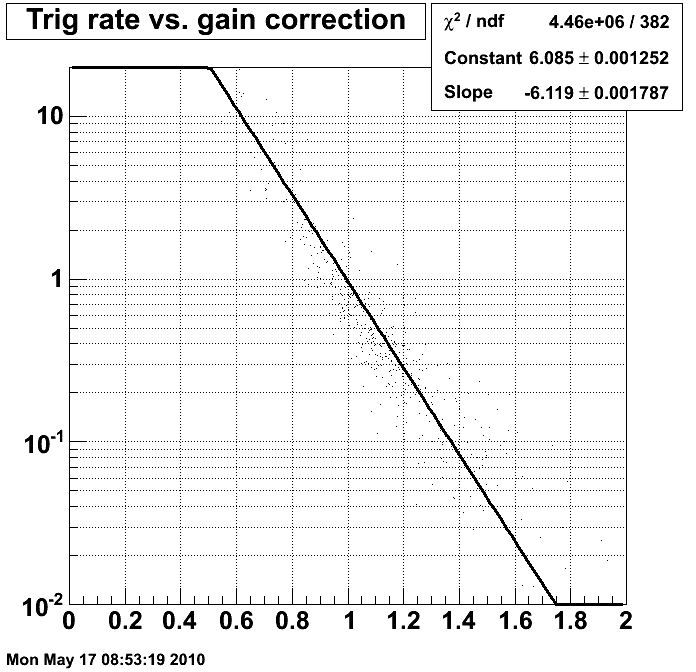
By using the gain calibration factors and emulating the real run 9 trigger algorithm, we can "predict" what the trigger rate should be from Pythia events and compare this simulated trigger rate to the real trigger rate in the data. A correction factor can be constructed from the difference and used in the next round of calibration. In order to do this, we need to know the relationship between trigger rate and gain correction factor.
Figure 1. Trigger rate (arb. unit) vs. gain correction factor in the small cell. Trigger rate is the results of dividing trigger rate with our current gain factors (dated 03/26/2010) by the trigger rate with idea gain factors. The reason of this is to get rid of eta dependence of trigger rate so only gain dependence is left. From the figure, we can see there is a nice correlation between trigger rate and gain correction factor. The fitted function tr = exp(6.085-6.119*g) is used to construct the correction factor.

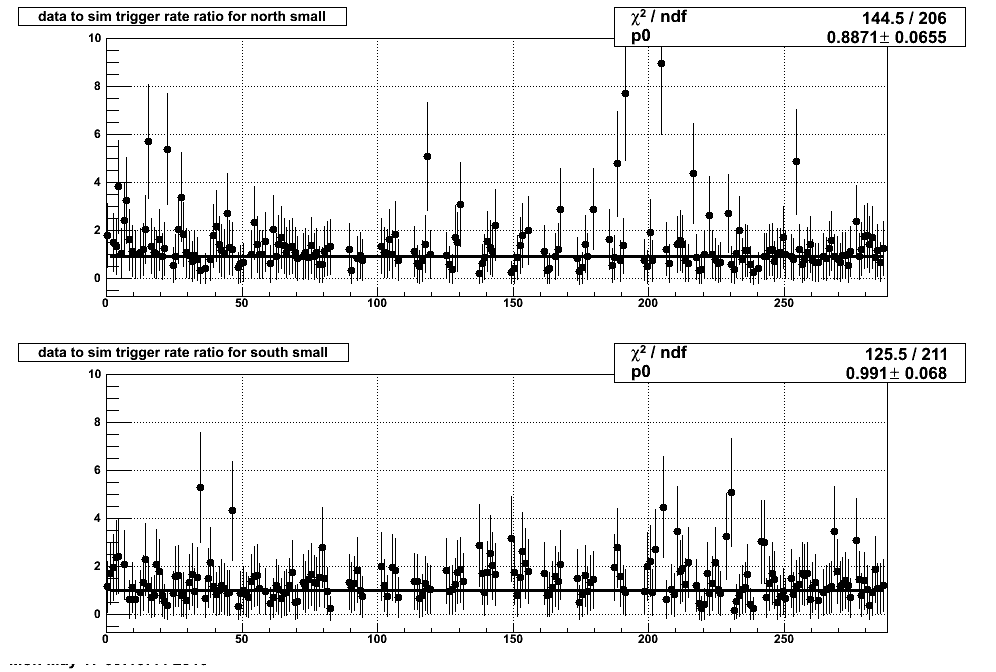
Figure 2. The ratio of trigger rate from real data to that of Pythia simulation as a function of detector channel number. The gain correction factors are from Steve on 03/26/2010. Some outliers are outside of the figure but we can see that most cells are already quite close to 1. This ratio, together with the formula from figure, is used to construct another factor and then this factor is added to the factor from Pi0 mass fitting with equal weighting (0.5*fmass+0.5*ftrigger)

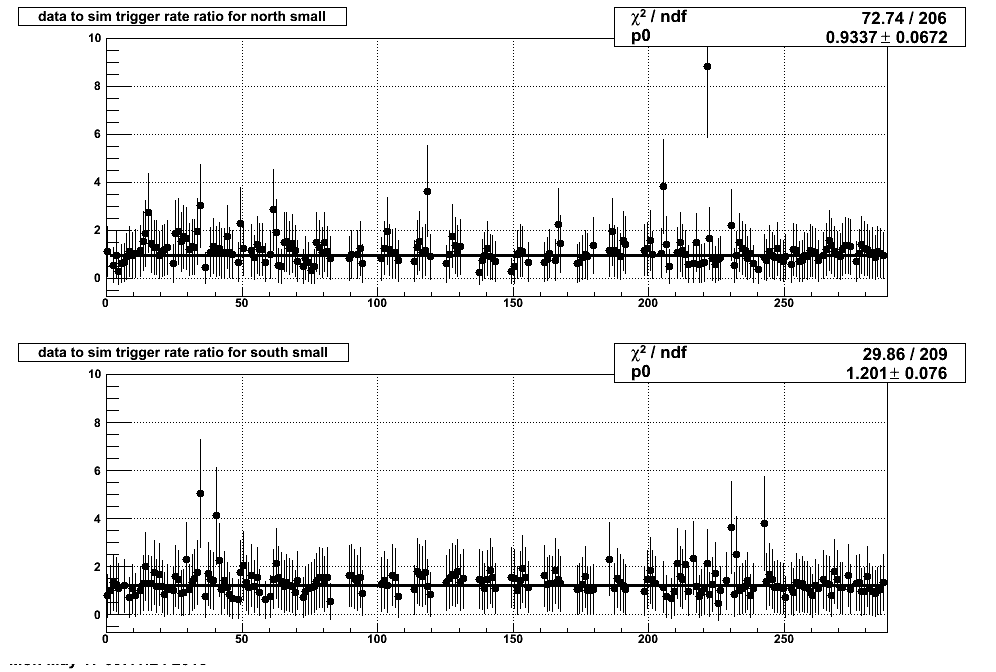
Figure 3. The same ratio as in figure 2 after two iterations of calibration. The trigger rate ratio is more close to 1.

Steve's plots of cell calibration quality is here with the most recent gain correction factors.
Figure 4.
- jgma's blog
- Login or register to post comments
