- jkadkins's home page
- Posts
- 2018
- 2017
- 2016
- 2015
- 2014
- December (3)
- November (2)
- October (4)
- September (7)
- August (2)
- July (3)
- June (1)
- May (4)
- March (4)
- February (3)
- 2013
- December (2)
- November (3)
- October (3)
- September (4)
- August (2)
- July (3)
- June (1)
- May (2)
- January (1)
- 2012
- My blog
- Post new blog entry
- All blogs
2012 Collins Plots Updates - Plotting vs. xF
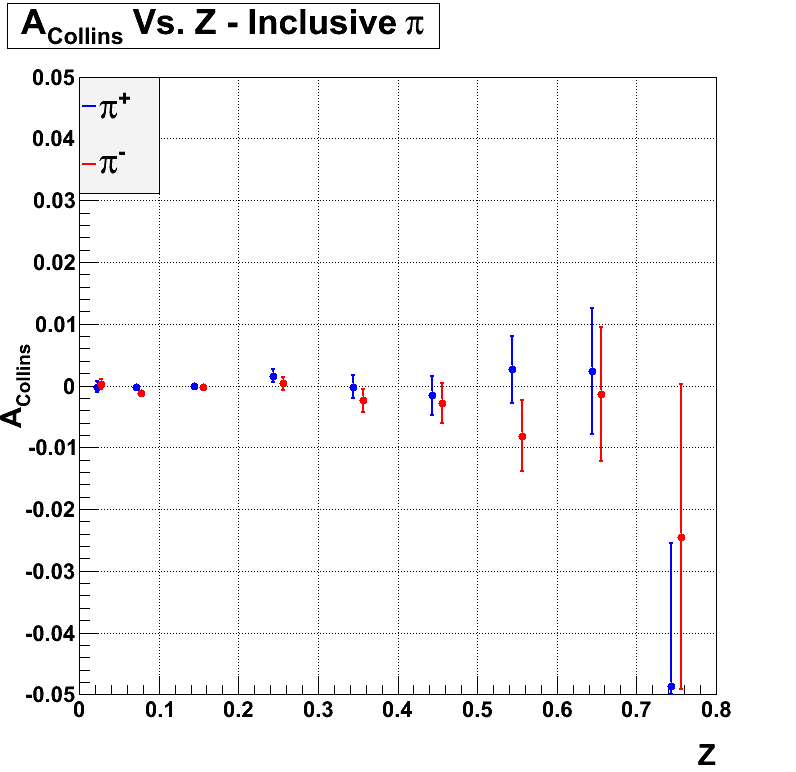
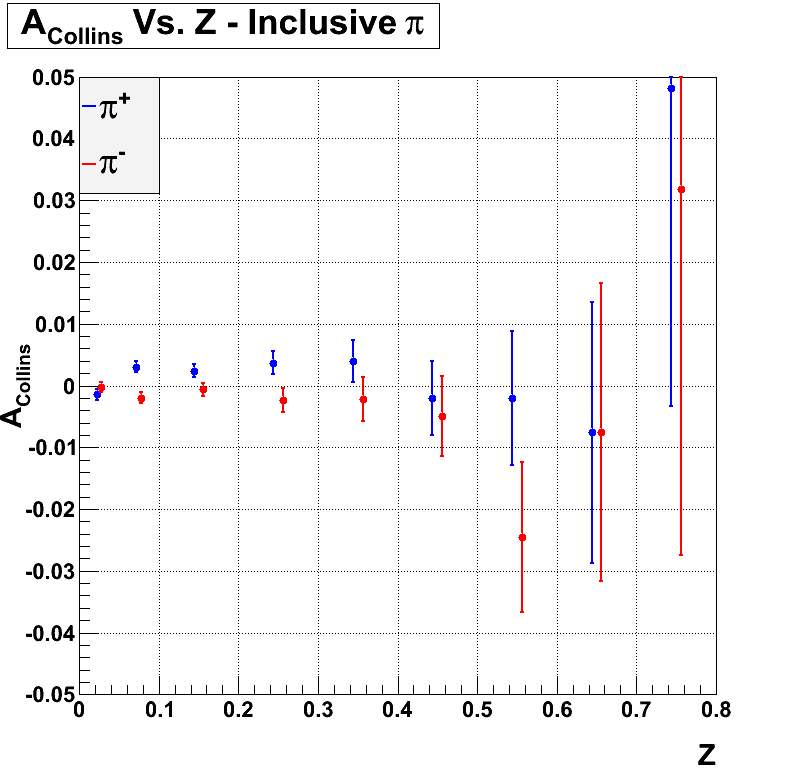
To show the agreement with Jim's analysis, the first plots show the xF < 0 plots when Collins is plotted versus Z. These are shown for both pT < 10 GeV/c (LEFT) and pT > 10 GeV/c (RIGHT)


Figure 1: Collins asymmetry as a function of Z for xF < 0. These are for both pT < 10 GeV/c (LEFT) and pT > 10 GeV/c (RIGHT)
Fitting these with a 0th order polynomial, we have:
| pT < 10 GeV/c | pT > 10 GeV/c | ||||
| Average | Stat. Error | Average | Stat. Error | ||
| pi+ | 2.28763e-05 | 0.000344812 | pi+ | 0.00141909 | 0.000504303 |
| pi- | -0.000556444 | 0.000351055 | pi- | -0.00114952 | 0.000508507 |
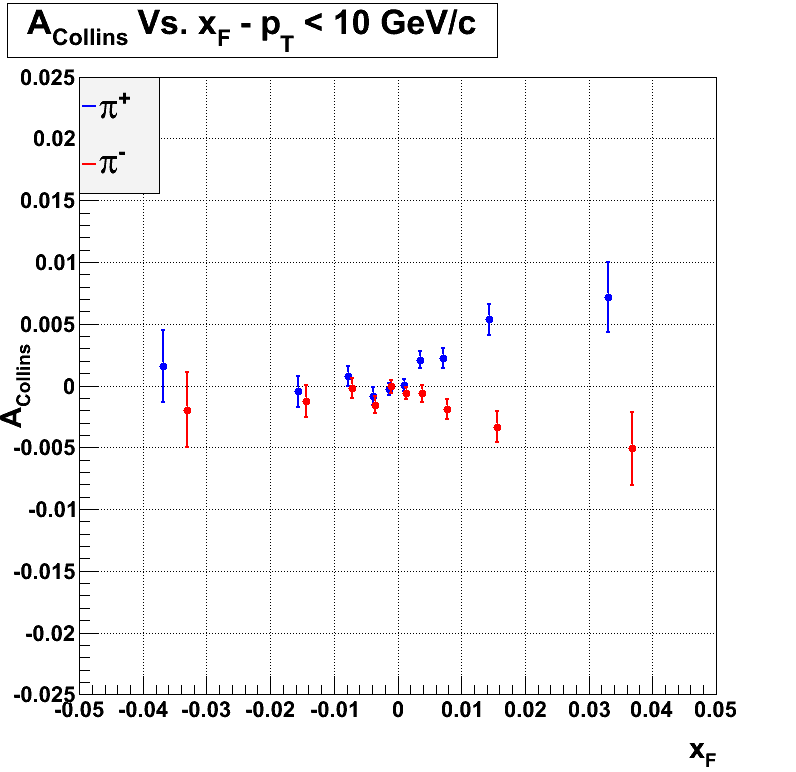
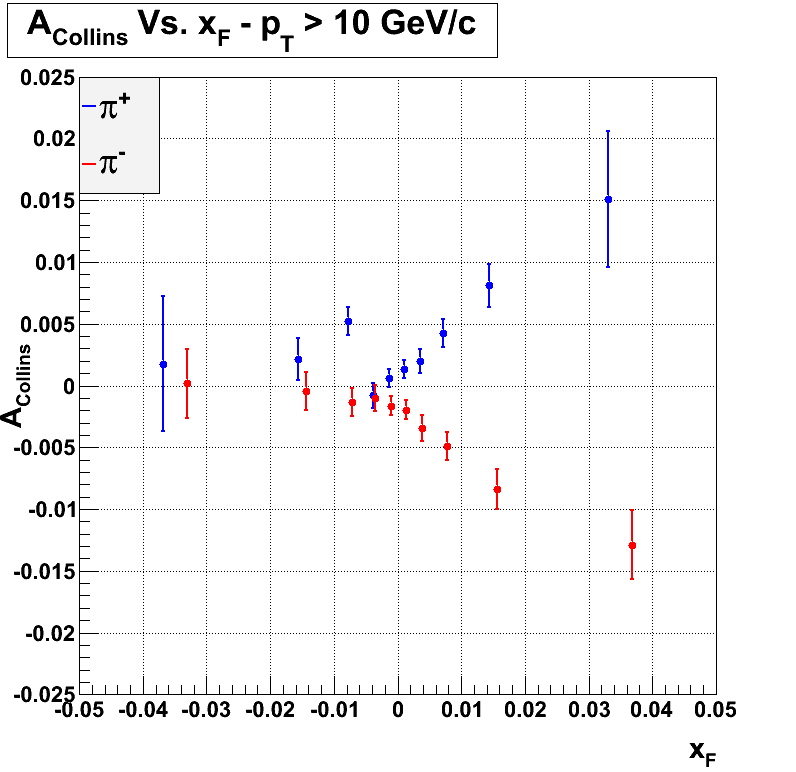
Binning yields in bins of xF allows for plotting the asymmetry for forward and backward scattered jets with respect to the polarized beam on the same plot. For pT > 10 GeV/c and pT < 10 GeV/c are shown below


Figure 2: Collins asymmetry as a function of xF for both pT < 10 GeV/c (LEFT) and pT > 10 GeV/c (RIGHT)
We are still trying to understand why the plot doesn't smoothly start to transition to zero for xF < 0, rather it seems to increase and then start a trend toward zero.
These can be split further into bins of z and jT. The bins I chose, which are purely experimental at this point and can be changed later, are:
0 < z < 0.2, 0.2 < z < 0.5, 0.5 < z < 1
0 < jT < 0.375, 0.375 < jT < 4.5
I will show these next time! The xF bins need to be adjusted for the decreasing statistics at higher z and jT. I will play with it this week to get a better set of plots, and I will also (finally) look at the eta bins that Jim has been looking at and give a double check on those numbers.
- jkadkins's blog
- Login or register to post comments
