run 2013 P14ia production -- updated as production progress
During the pp500_production_2013 P14ia production in progress, I roughly have a look at some MuDst files which have been stored at RCF disk.
************************Feb 28****************************************
runlist: run14076005-14126015
PDF movies: Barrel, Endcap
With much larger statistics, The most of the plots still look good. Following Feb 26 's blog ( See below of this page), I tried to figure out the strage distribution of etower sum per event. Via talking with Jan and Qinghua, we suspect that the strange 2nd peak was casued by hot tower. Then I do below studies.
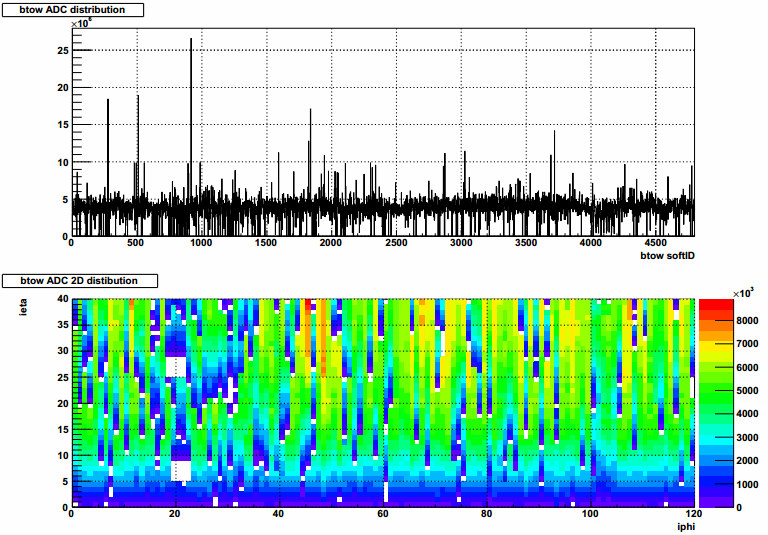
1) I numbered the 4800 barrel towers and sum all the adc values for each tower. Below is the 1-D distribution as function of tower index and 2-D distribution vs iphi and ieta. I am not sure "my" tower index is the generally used . From the plots, There are several hot towers. Need to confirm from EMC DB, if these hot tower have been fixed or excluded.
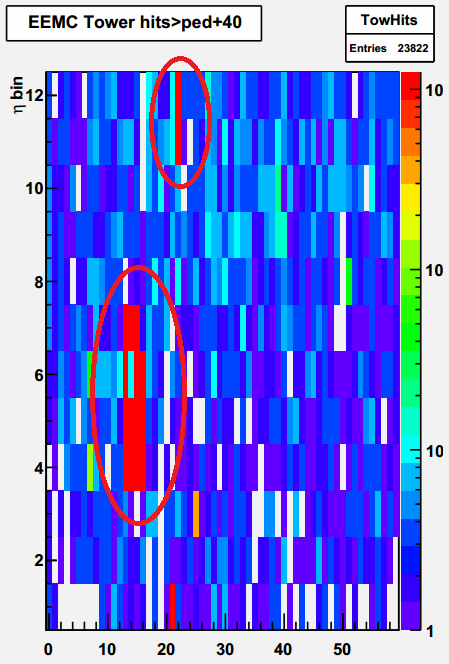
2) Similar with barrel tower, below plots show the distribution of etower adc. There are serious hot towers can be seen.
.png)
Go back to our manually QA result, I found in Zilong's part, Runs from fill 17451 have a large hot tower region. This is an example from online shift plots.
As shown at below item 7) endcapsumADC. are difference from run12 P13ib production.
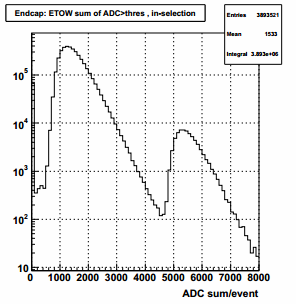
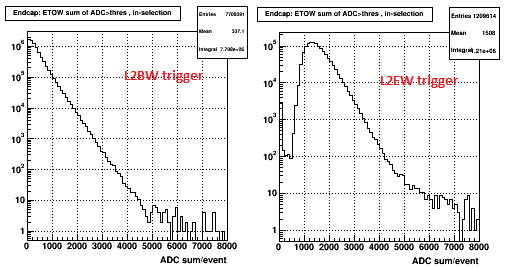
As far as my understanding, It should be due two the seperated st_WB and st_WE stream. Every event from st_WE was triggered by L2EW. They always contain at least one high tower which exceed the EHT1*L2EW threshold, 10GeV. So, there should be non-zero peak,(first peak in below plot). However, in previous dataset, L2BW events and L2EW events had been stored in the same stream st_W. So the etow adc sum distribution will contain many events triggered by L2BW which didn't have high etower. So the distribution should similar to exponential, namely no signficant non-zeor peak pronounced. The Secon peak is very strange. After investigation, It should be casued by above hot tower region.
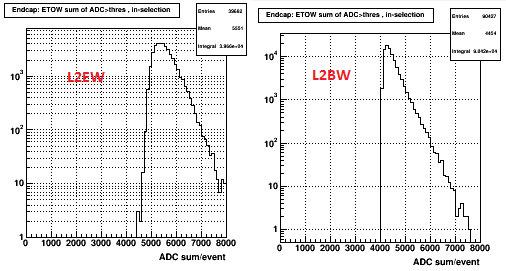
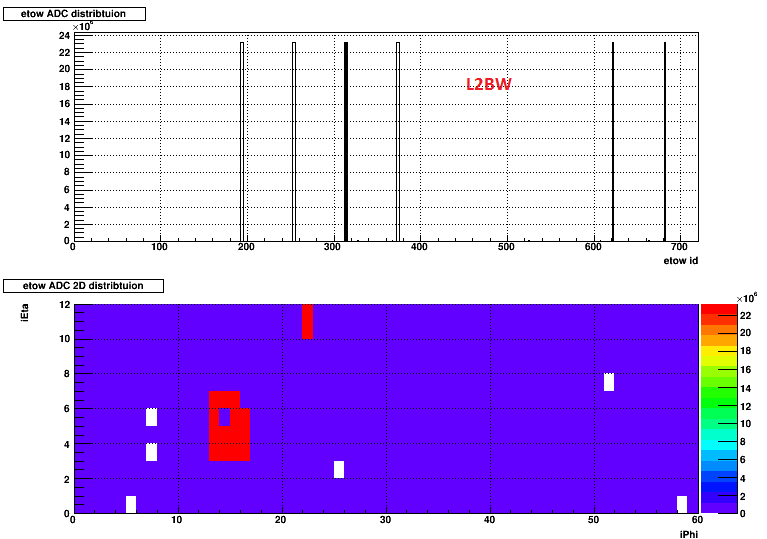
Plots from those runs with hot etower region:
ADC sum per event distribution:
adc distribution by etower index:
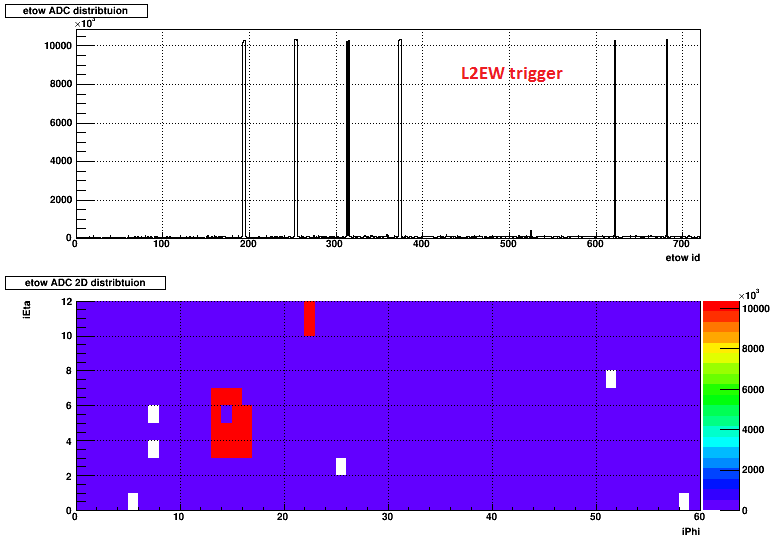
etower adc from l2bw trigger:
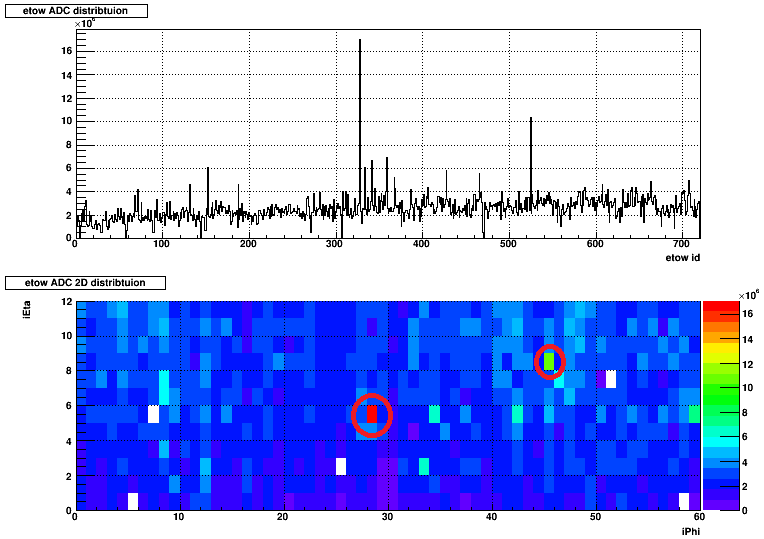
After excluding those runs with hot etower region, the second peak expectedly went away, as below plots of etower adc distribution.
There still are single hot towers. Maybe they are not too serious, we also need to be careful with them in the analysis.
Conclusion: We should excluded those runs of fill 17451. Also we should be carefull with other possible hot towers.
************************OLD: Feb 26****************************************
run 14113019 -- 14126015 , 1498 MuDst files :
PDF movies: Barrel , Endcap
All the plot looks reasonable,
1) vertix effiency for barrel party ~0.93, improved from run13 P13ib production ~0.91.
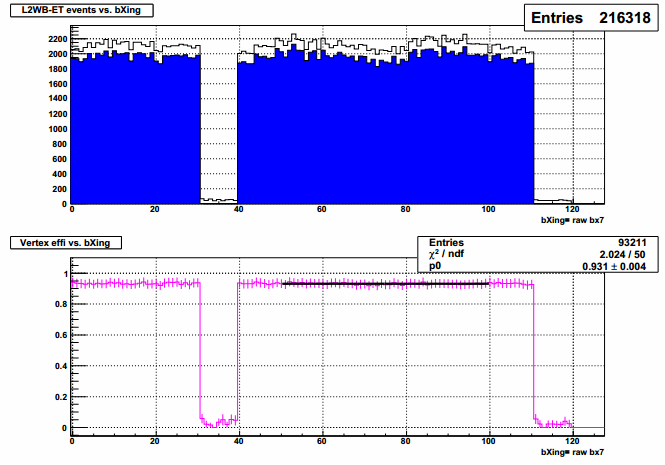
2) Peak of Chi2/dof distribution shows a little larger than previous production. Gene explained this at W meeting. Maybe this is not a big deal.

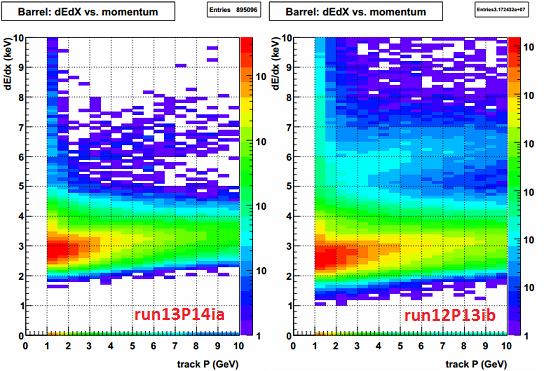
3) dE/dx distribution as function of track momentum, looks good
4) Charge separation: looks reasonable, It is expectedly worse for endcap than for barrel. Can FGT help here ?
.png)
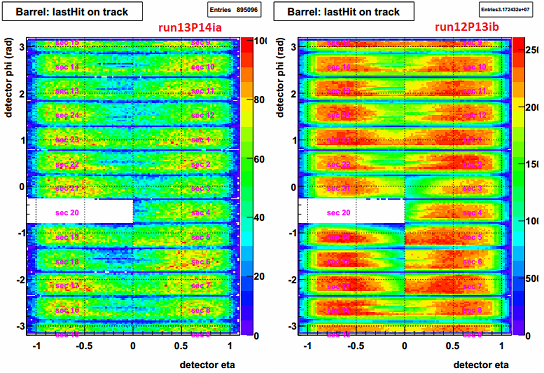
5) Postion of last hit on track :
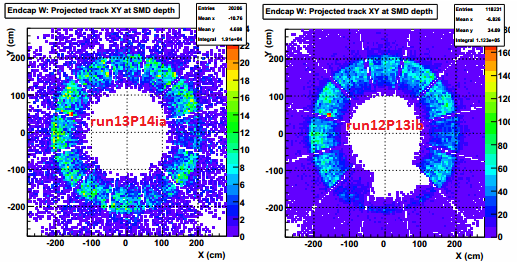
6) Endcap: Projected track XY at SMD depth :
7) Endcap Etow sum of ADC distribution shows two peaks, different from previous prodcution. I still can't understand this. Futher attention need to be paid here.
.png)
This will be updated with more statistics as production going on....
- jlzhang's blog
- Login or register to post comments
