- jlzhang's home page
- Posts
- 2024
- March (1)
- 2022
- 2021
- December (1)
- 2019
- April (1)
- 2018
- 2017
- 2016
- 2015
- December (1)
- November (1)
- September (3)
- August (1)
- May (1)
- April (1)
- March (4)
- February (5)
- January (3)
- 2014
- December (4)
- November (4)
- October (2)
- September (3)
- August (4)
- July (3)
- June (4)
- May (2)
- April (1)
- March (2)
- February (2)
- January (1)
- 2013
- My blog
- Post new blog entry
- All blogs
Hot BEMC towers in jet reconstruction
To simply study the impact of hot tower on the jet finding, I pick up 50 runs ( 0.6M events) to see the difference of the jet and W yields before and after masking out the towers.
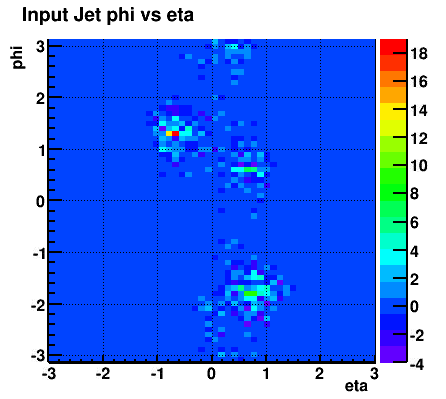
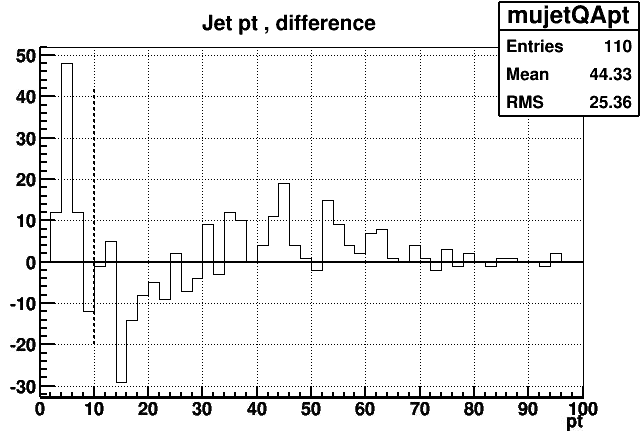
Belo plots show the differences of the eta-phi distribution and pt distribution of the reconstructed jets.


Below plot shows the comparison of the events counting distribution for W reconstruction step by step. The reconstructed jets are used for background rejection. The jet distribution and their pT will impact the sign-pT balance. In below plot, the bin "noAway" shows the count after the sign-Pt balance cuts, ONE events different between before and after the masking.
.png)
Groups:
- jlzhang's blog
- Login or register to post comments
