DAQ etof issue symptoms
Updated on Mon, 2018-06-11 11:15. Originally created by jml on 2018-06-11 11:13.
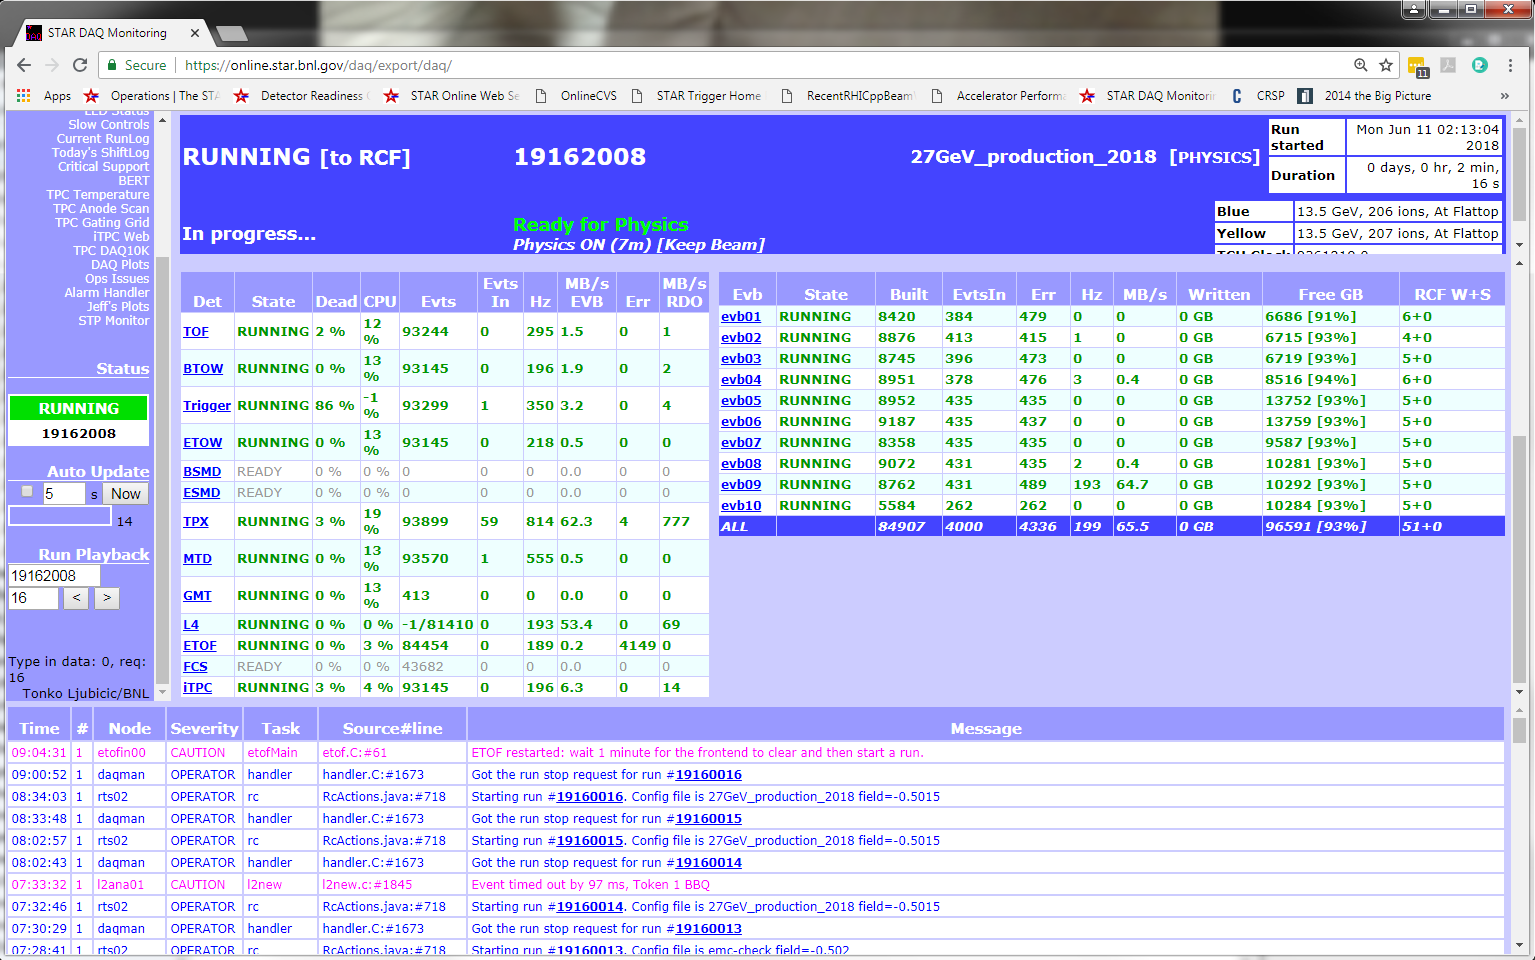
On the daq monitor main page: Look at the "Dead" column in the trigger row. This should always be zero while running. When the etof is acting up, it will show a high trigger deadtime every 30 seconds or so. If not 0 (currently anywat) it is usually the etof acting up.
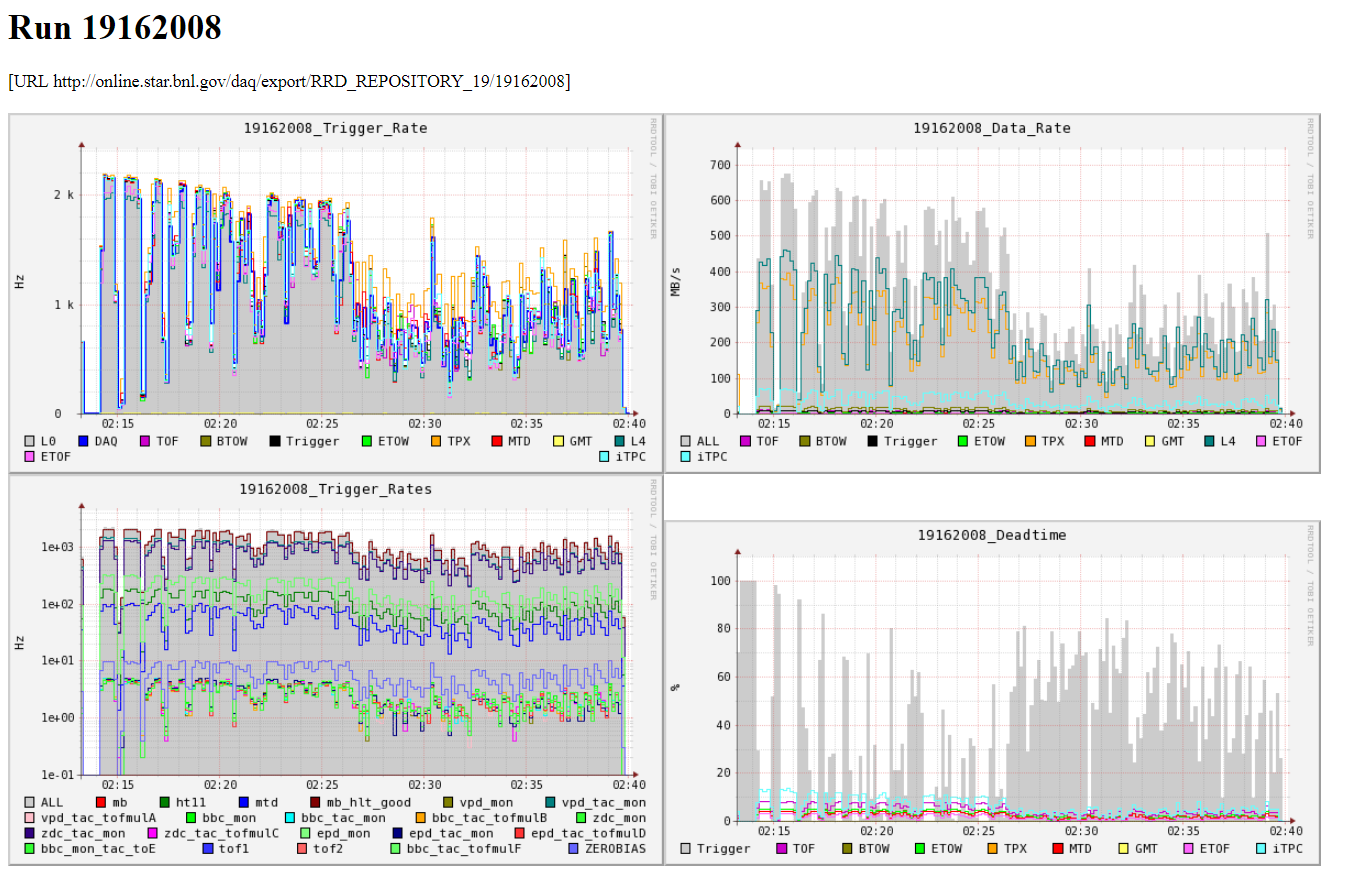
On the monitor page, select "current rates" This shows a time series of the rates. This (bad) run is shown below. The problem is seen in all of the plots, but the give away is the bottom right plot. The "grey" is the trigger deadtime, which should always be zero or close to zero.
»
- jml's blog
- Login or register to post comments