Plots for TPC sizes
I added a flag for ADC only events. These plots are all run 19132076.
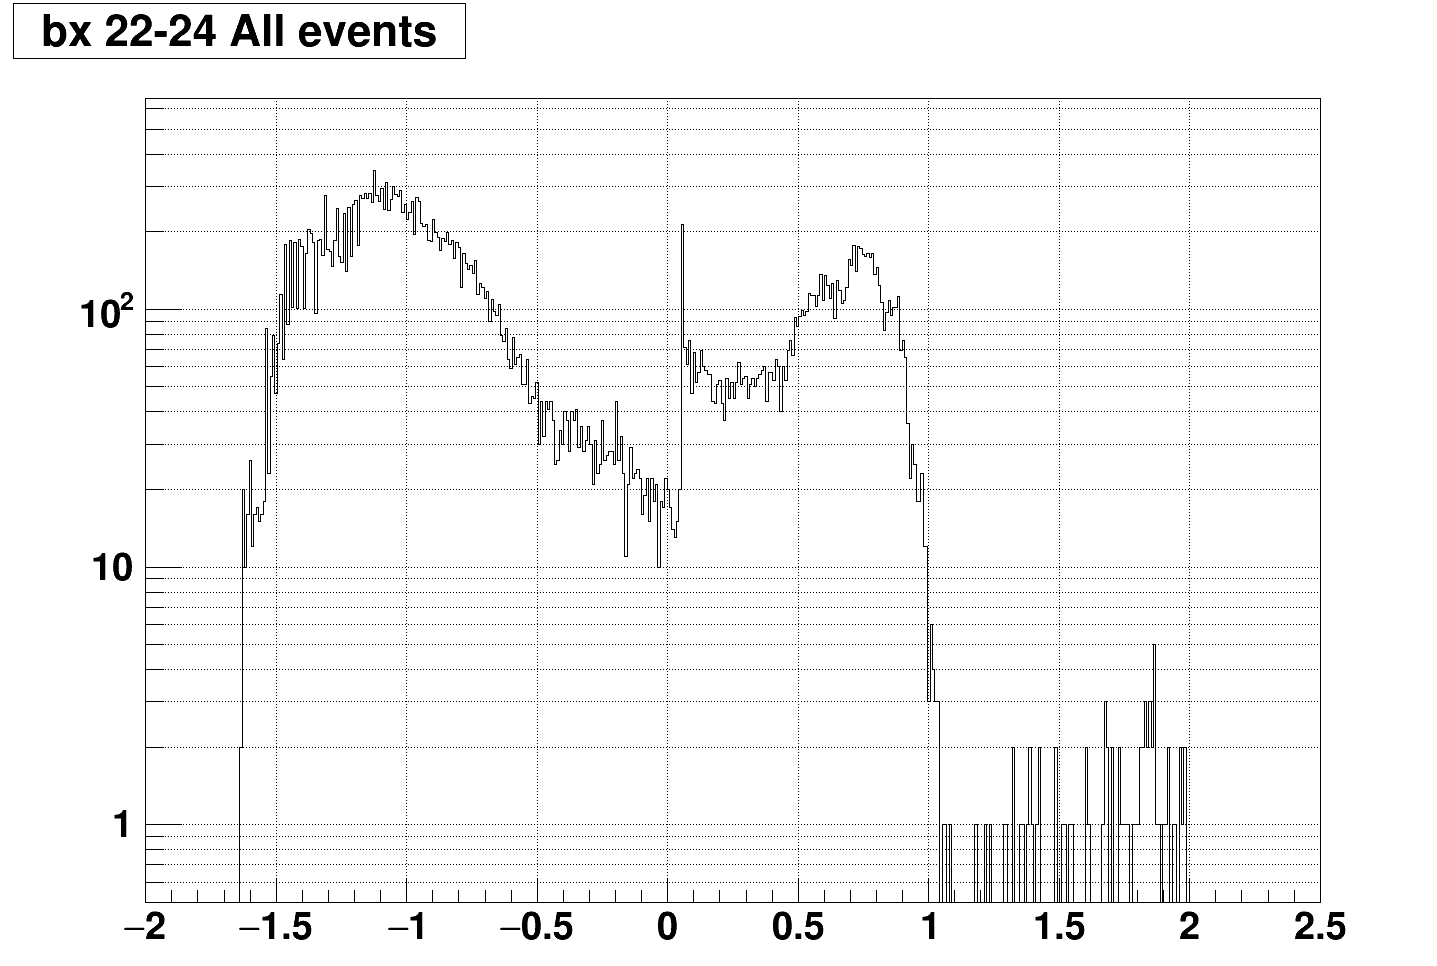
Gene's plot for this run (histogram of log10(sz) for events with bunch crossing 23,24,25):
If adc only events are removed:
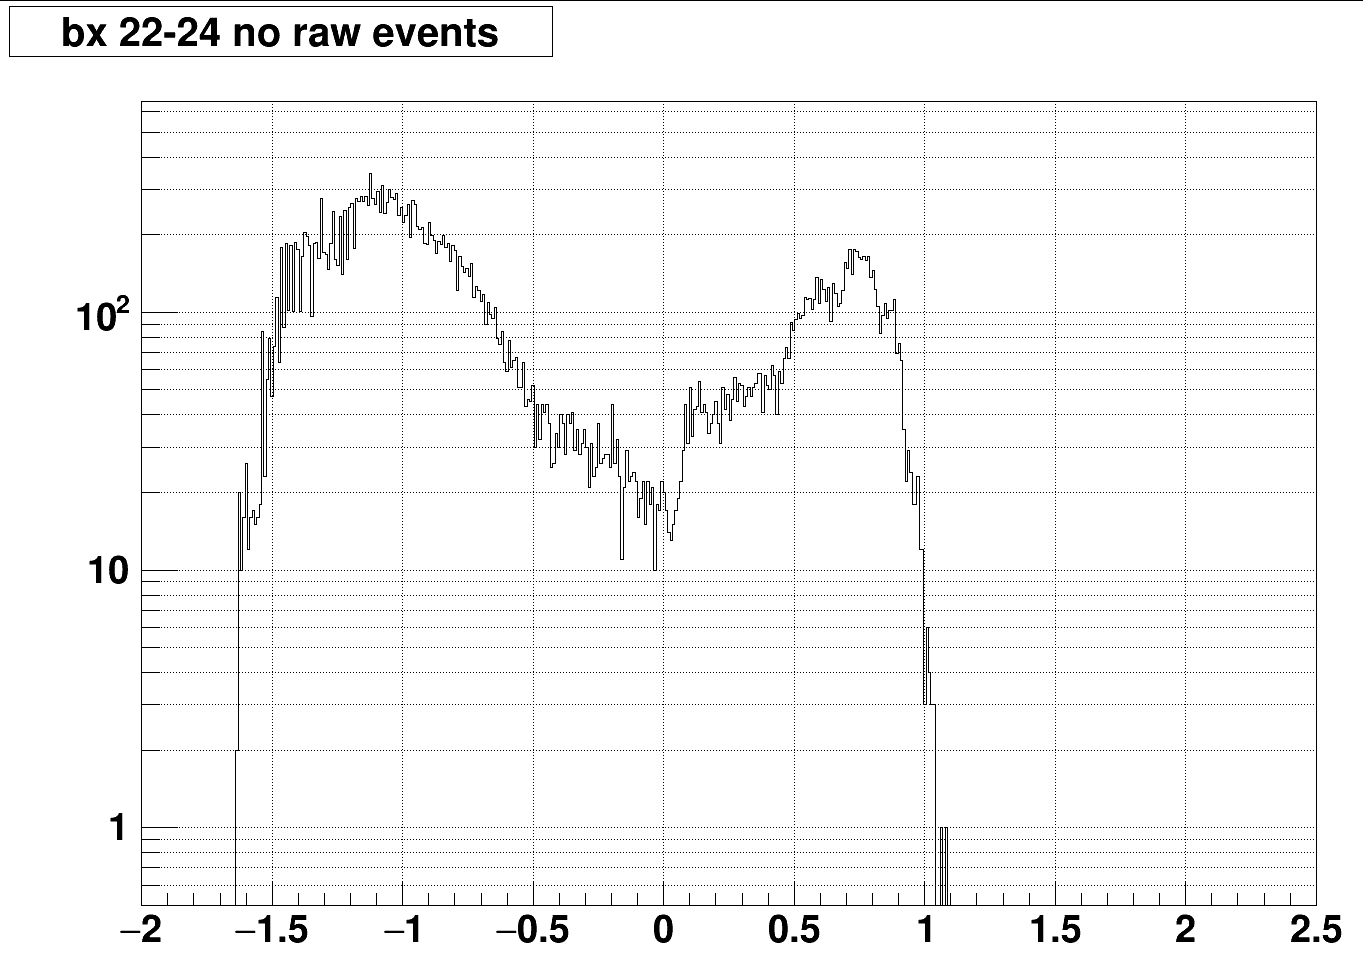
We see the same behavior, but without the sharp peak at 1.1MB!
The reason for this is that the ADC events (this time over all bunches) look like the following:
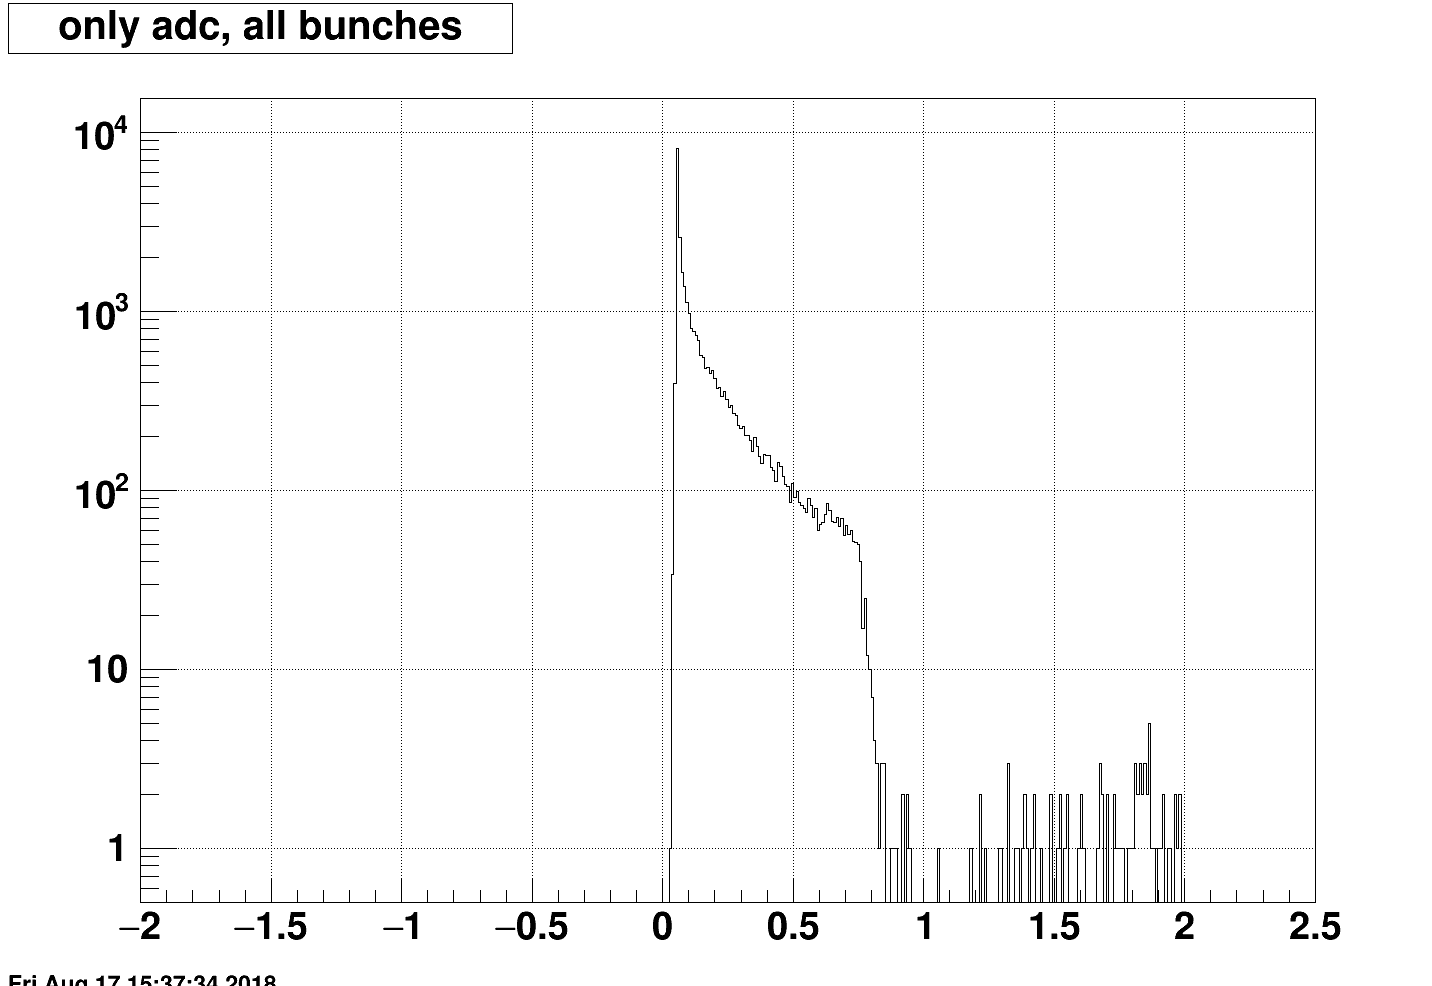
With a strong turnon right at 1.1MB... Nonetheless, other than the peak right at 1.1MB, the effect of these events is quite small because they only make up 1% of the data.
The summary is that I believe the first peak, with sizes below 1MB are "normal" events contaminating the abort gap. The peak well above the 1MB size correspond to the abort kicker events. The narrow peak right at 1.1MB corresponds to the raw adc events...
- jml's blog
- Login or register to post comments