QT corruption (after strain relief to fix clock signals)
After the strain relief fix for the QT crates we have seen QT corruption on the following runs:
In all cases, Akio's RCC timing plots do not show any problems (presumably because the errors occured after the timing plot entries end)
| 18063005 | pp500_production_2017 | * 1 corrupted event in the MIX crate * production run firing @ 1.4khz |
| 18065012 | pp500_production_2017 | * 2khz, then FMS triggers fire at 6.3khz |
| 18065027 | akio_fms17 | * 3khz, then suddenly FMS triggers fire at 7.5khz |
| 18065028 | akio_fms17 | * 3khz, then suddenly FMS triggers fire at 5.5khz |
| 18065029 | pp500_production_2017 | * 2khz, then suddenly FMS triggers fire at 6khz |
| 18066027 | akio_fms17 | * 3khz throughout run |
The middle 4 runs are easy to understand. The reason the corruption occured is because suddenly the FMS triggers started to run away at the RHIC clock frequency, which caused the readout to overrun the maximum rates.
The other 2 runs had interesting and different failure modes:
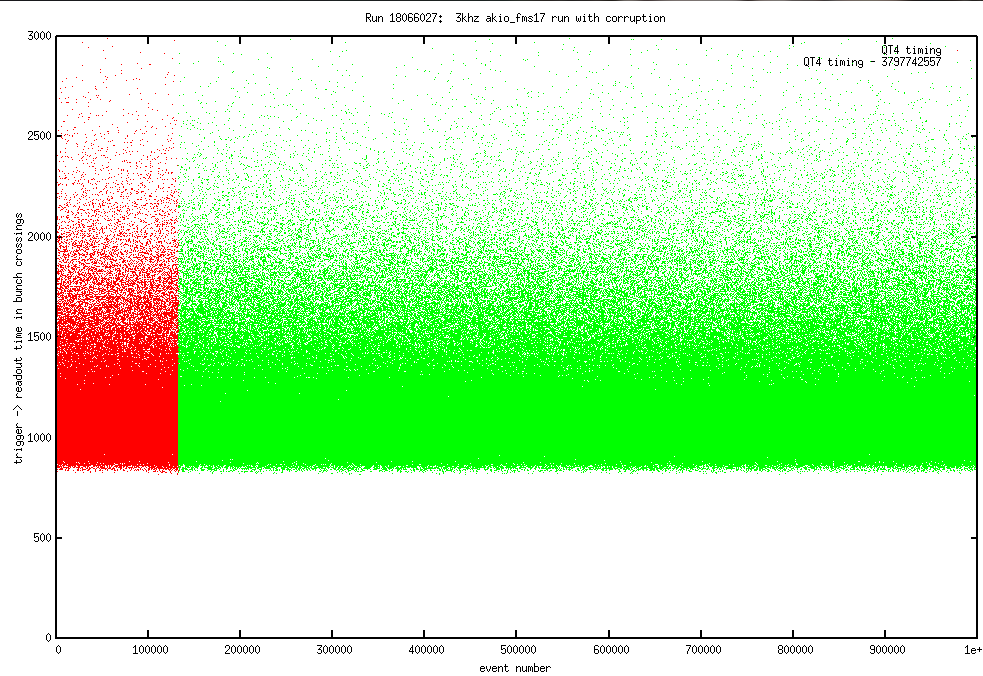
Run 18066027: Here the rates never increased. However it appears that there was a clock glitch that ONLY affected QT4, but unlike the pre-strain relief glitches it did not lead to a stuck RCC counter. Instead afte about 132k evts into the run suddenly the QT4 clock set to 0, but then started counting normally:
evt qt4 counter
--- ------------
I have no understanding of what would cause this.
Here is a plot that shows that the QT4 counter (aside from the offset) is still counting, and that in fact no events should have been truly corrupted:
(On the plot I show the QT4 timing as well as its timing with the offset subtracted.
I also took a look at one of the runs where the FMS trigger ran away. here, it was obvious why the corruption could occur, but I wanted to see the details of how it actually happened:
Run 18065028:
Here, after about 1.445e6 events, the trigger rate ran away. I'll first plot the QT sizes:
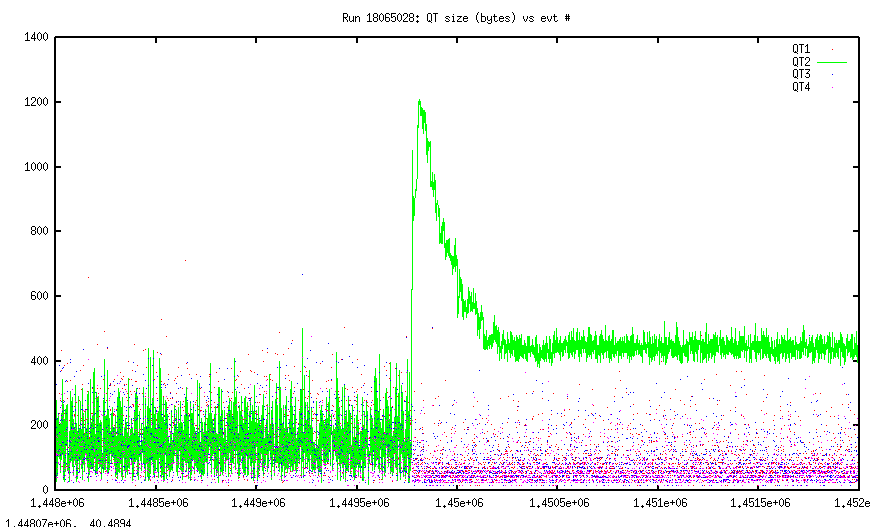
You see that, most likely something readout by QT2 was the culprit. After the increase in rates the QT2 occupancy goes way up, while the occupancy of the other crates goes way down (because they aren't real events!) The QT2 size, however, seems to go through some relatively quick decay, and then plataue.
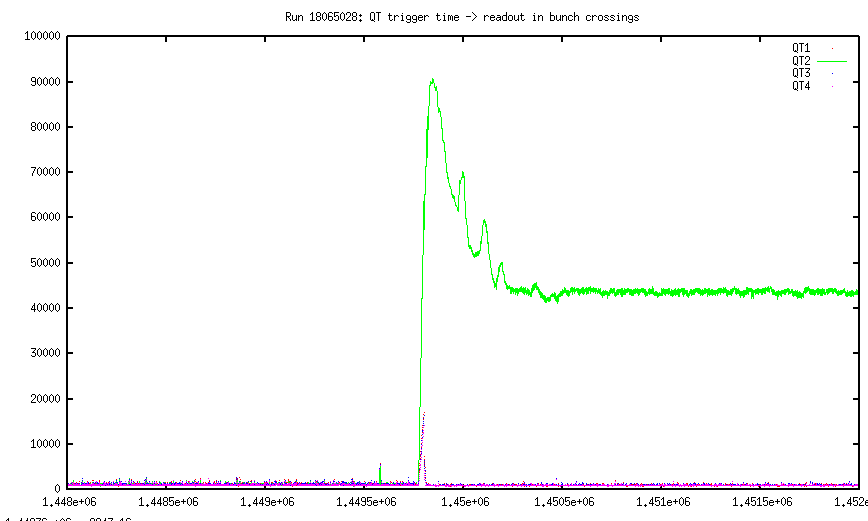
In the timing you see the same exact feature, and in fact once the size of the QT2 gets down to 50% or so we don't see any more wrap around corruption (though obviously the data is bad for some other reason). Even in this pathological run the number of corrupted events is rather small.
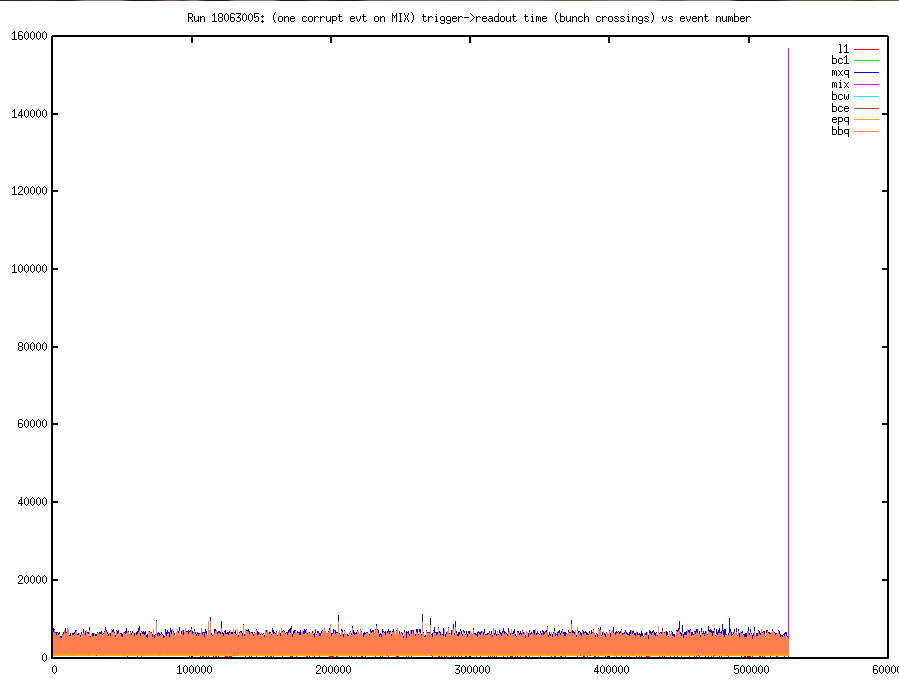
Run 18063005:
This was a physics run at 1.4khz. There was a single wrap-around corrupted event (in the MIX) crate. This was the very last event.
It turns out that the reason the run stopped was a problem in the MIX crate:
So, apparently the final successful event was delayed, but it caused a general upheaval of the system....
The timing, overall, looked good. Here are the plots:
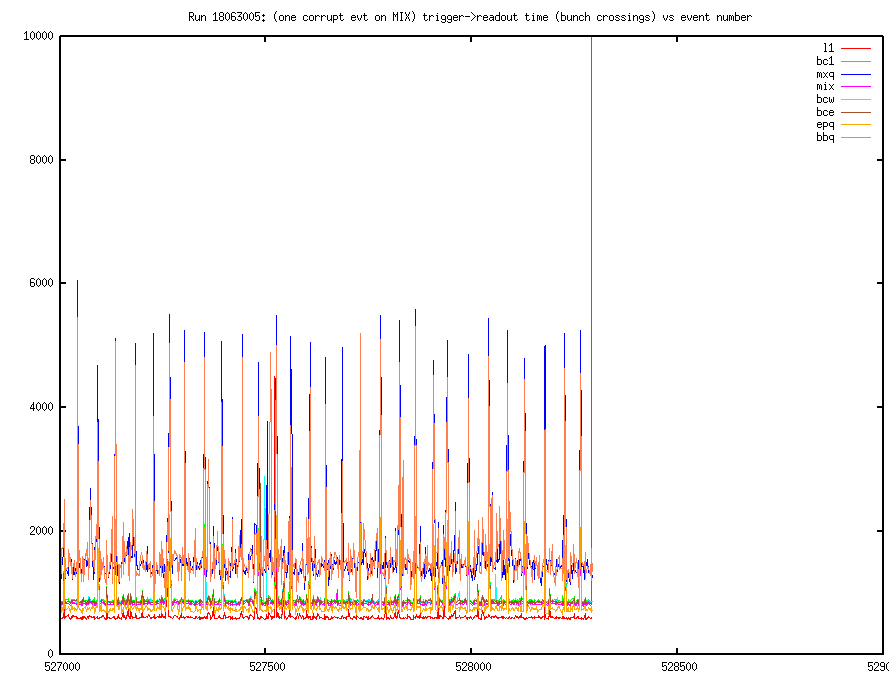
Other than this event, the readout seemed to be very well behaved!
- jml's blog
- Login or register to post comments