- jwebb's home page
- Posts
- 2019
- 2018
- 2017
- 2016
- 2015
- 2014
- 2013
- November (1)
- October (1)
- September (1)
- July (1)
- June (1)
- April (1)
- March (3)
- February (1)
- January (1)
- 2012
- 2011
- December (2)
- September (3)
- August (5)
- July (6)
- June (6)
- May (1)
- April (5)
- March (5)
- February (2)
- January (2)
- 2010
- December (3)
- October (3)
- September (2)
- August (2)
- June (2)
- May (4)
- April (4)
- March (2)
- February (4)
- January (10)
- 2009
- 2008
- 2007
- 2006
- July (1)
- My blog
- Post new blog entry
- All blogs
Geometry Differential Framework [first test on EEMC in y2009 vs y2009a]
1.0 Description of the Framework
- Tracking Global Changes to the STAR Geometry Model
- Position -- A 2d histogram showing the r,z at the point where a geantino intersects each detector volume is filled with weight equal to the distance from the origin to that point of intersection.
- Dimension -- A 2d histogram showing the r,z at the point where a geantino intersects each detector volume is filled with weight equal to the path length the geantino follows in passing through that volume.
- Composition -- A 2d histogram showing the r,z at the point where a geantino intersects each detector volume is filled with weight equal to the radiation length (in g/cm2) reported by the model.
- Physics -- This remains to be done.
A detector element in the STAR geometry model is represented by a volume. Each volume has an associated shape, a material and a tracking medium assigned to it. In short, four quantities are represented: (a) dimension, (b) position, (c) composition and (d) physical processes. Ideally we would like to track changes in these quantities.
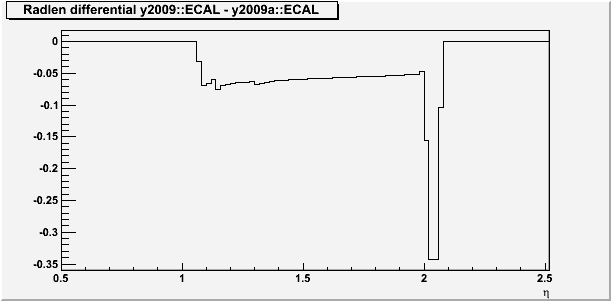
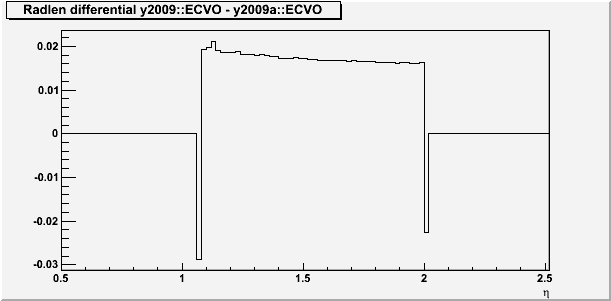
A difference plot can then be made between any two instances of the STAR geometry, say, between y2009 and y2009a. Any differences observed can then be studied in more detail using the more expert-level part of the framework.
- Debugging Subsystem Geometries
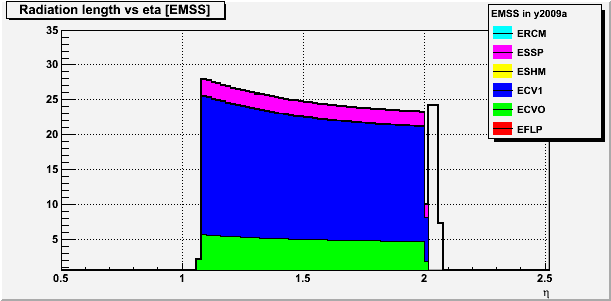
Tools already exist to visualize the shape and placement of detectors. The problem is that they will happily draw the detector volumes as defined... but the material associated with those volumes could be crazy (e.g. iron = air). The main purpose of this framework in debugging geometries is to fill in the additional information of "what material is seen by a particle traversing this volume". This is achieved by plotting the number of radiation lengths encountered as a function of the pseudorapidity of a geantino passing through the volume.
The volumes for which histograms are booked and filled are defined by the user in the macro. The definition would look something like:
    steps->bookVolume("ECAL"); // Endcap calorimeter envelope
    steps->bookVolume("EMSS"); // Structural steel
    steps->bookVolume("EFLP"); // Front plate
    steps->bookVolume("ECVO"); // Volumes w/ radiators and megatiles
      steps->bookVolume("EMOD"); // Endcap module (sector)
    steps->bookVolume("ECV1"); // 2nd instance of ECVO, after the SMD layer
    steps->bookVolume("ESSP"); // Back plate
    steps->bookVolume("ERCM"); // Tie rods
    steps->bookVolume("ESHM"); // Shower-maximum section
    steps->bookVolume("EPSB"); // Projective stainless steel bar
    steps->bookVolume("ECHC"); // CCStainless steel cover
The resulting histograms can be combined to show what the total radiation length for a given detector is, and what the contributions of each subdetector is. (n.b. that building such plots at this point requires a certain level of expertise with the geometry file, the vagaries associated with the AgSTAR automagic naming conventions, etc...)
2.0 Some Example Plots in the EEMC
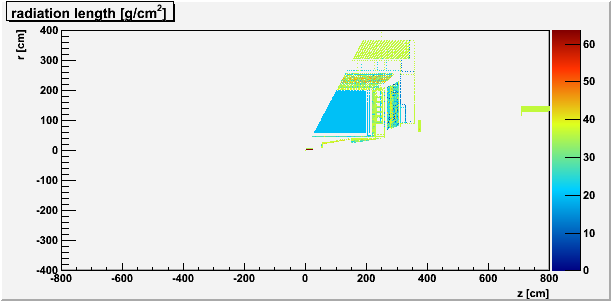
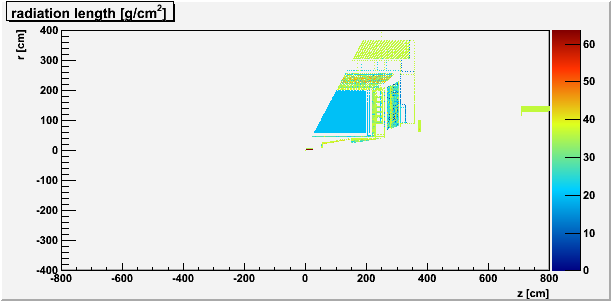
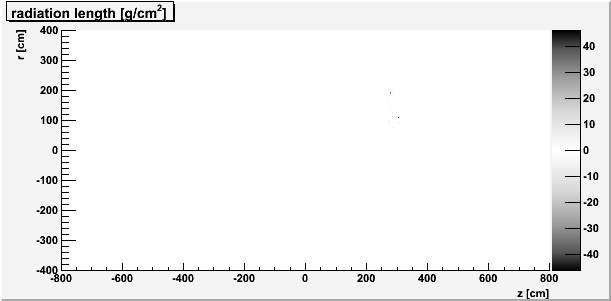
3.0 Material Balance / Debugging Histograms
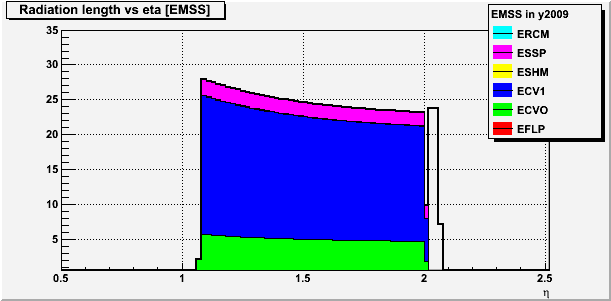
.png)
.png)
- jwebb's blog
- Login or register to post comments
