Abstract: We examine pi0 invariant mass spectra from the 2006 run, using isolated pions with no energy deposited in the 1st preshower layer w/in a radius of 0.3. An invariant mass of 139.0 +/- 0.3 MeV is reconstruced, with no observed dependence on pseudorapidity. Conversion rates observed by the preshower layers for identified pi0 decays, indicate that, on average, there are three photons w/in the cluster used to measure the energy of the pion.
Contents:
Approximately 880 runs from pp2006. Loose QA selection.
The pi0 maker is configured with low seed thresholds, since we will be performing isolation and charged-particle cuts on the data which will kill off backgrounds.
mEEclusters=new StMyClusterMaker("mEEclusters", mEEanalysis, mMuDstMaker );
mEEclusters->setSmdSeedEnergy( 1.5, 0.0 ); // seed and slope [MeV]
mEEclusters->setSmdMaximumSize(4);
mEEclusters->setSmdMinimumStrips(5);
mEEclusters->setSeedEnergy(2.0);
mEEclusters->setMinimumEnergy(0.5);
mEEpoints=new StMyPointMaker("mEEpoints",mEEanalysis,mEEclusters);
mEEpoints->setSplit();
mEEpoints->setSplitMinimumET(4.5);
- Select triggers: 137641, 6, 127641, 137273, 137652, 137551, 137222, 137622. These include EEMC L2gamma, jet and dijet triggers.
- Isolation cut: Sum energy w/in R<0.3 of the leading photon in the pair. Require 90% of energy associated w/ leading photon.
- CPV cut: Sum energy deposited in preshower-1 w/in R<0.3. Veto events with energy > 0
- Analysis cut: Sum energy deposited in preshower-2 w/in R<0.3. Increment conversion histogram(s) when energy > 0 (3 sigma > ped).
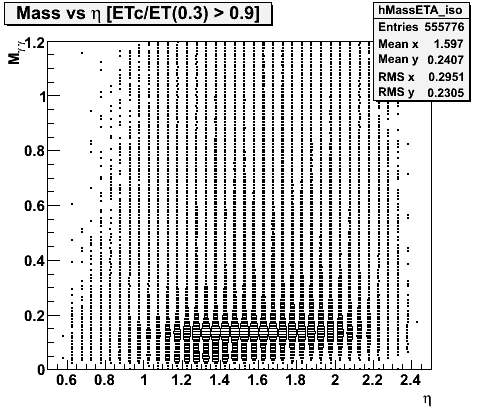
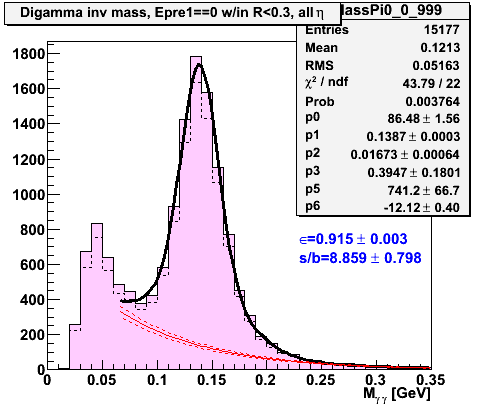
A total of 0.5M pairs of photons pass the isolation cut. These are shown in figure 1 as the 2D spectrum of invariant mass vs. eta. Of these events, 15k pass the additional criteria that no energy is registered in the 1st preshower layer. The mass spectrum for this set of events is shown in the right hand panel. The fit which is performed is described below.
Figure 1 -- Left: 2-photon invariant mass vs. eta, for events which pass an isolation cut requiring that 90% of the energy w/in R<0.3 is accounted for by the leading photon in the pair. Right: Invariant mass spectrum for events which additionally satisfy the charged-particle-veto cut: no energy registered w/in R<0.3 in the 1st preshower layer.
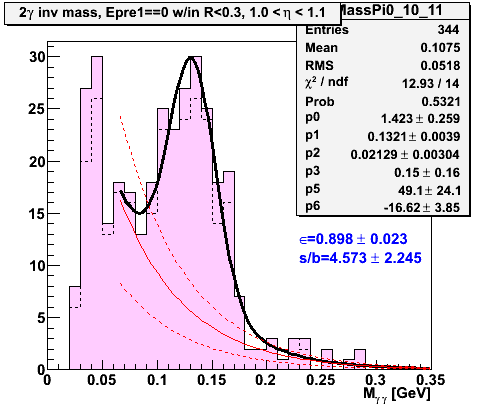
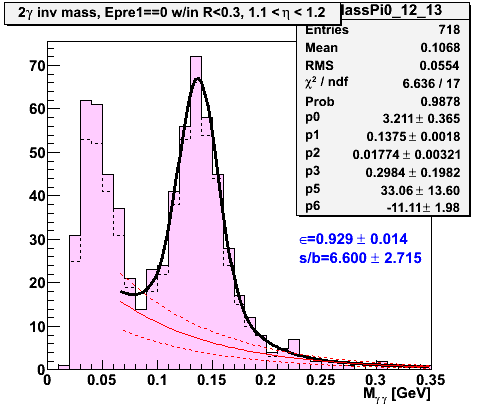
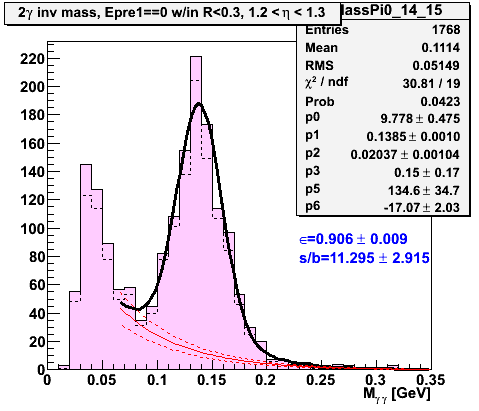
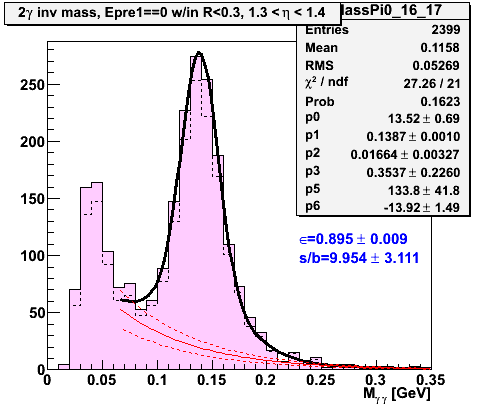
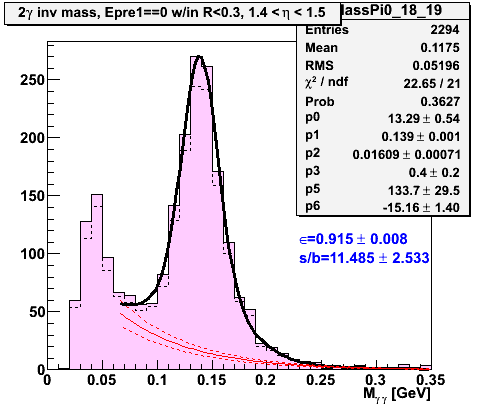
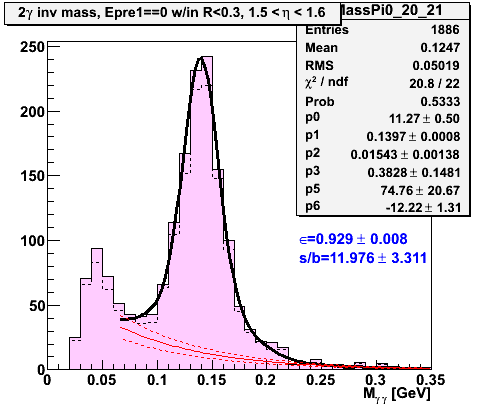
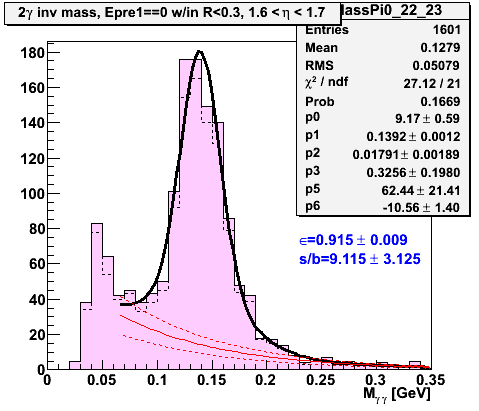
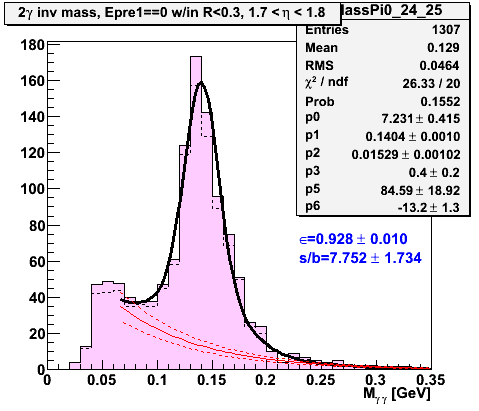
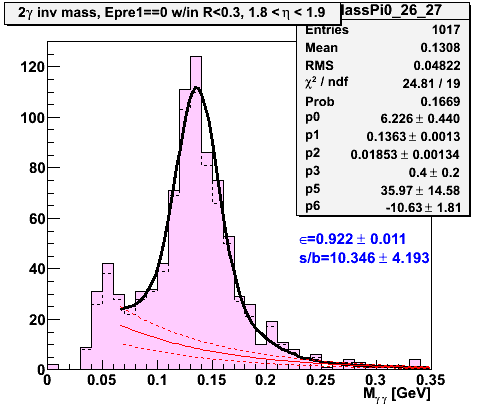
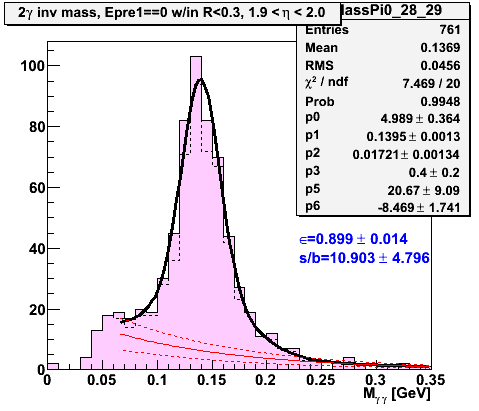
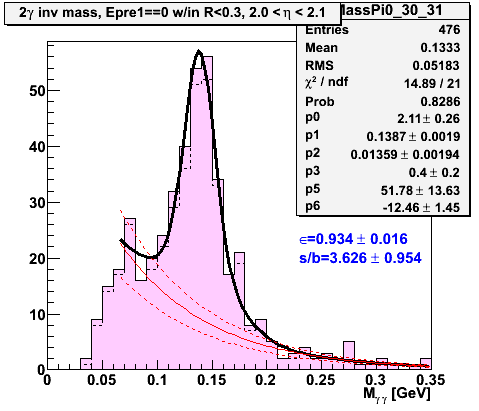
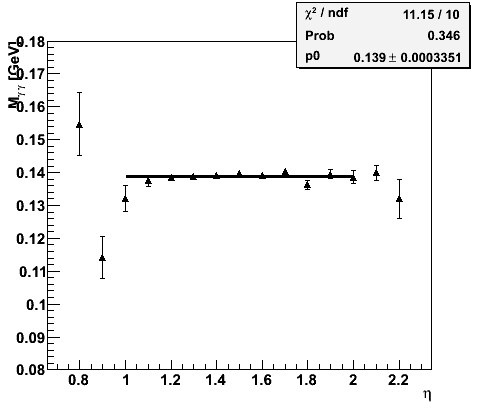
The invariant mass spectrum for bins 0.1 wide in eta is fit to a double-gaussian (with constrained mean and width) plus an exponential background. The fits are shown below, and most exhibit acceptable χ2 values. From the fits to the mass spectra we extract the invariant mass in each bin in eta. This is plotted in figure 2. A fit to a flat line is performed over the nominal acceptance of the endcap. The χ2 to this fit is acceptable, indicating that the data show no eta dependence. The reconstructed pi0 mass is slightly high, at 139.0 +/- 0.3 MeV.
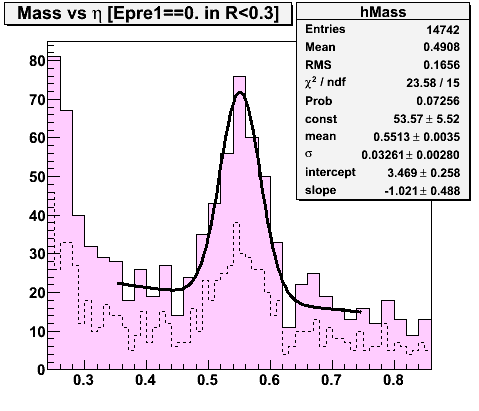
Figure 2 -- Left: Stability of the pi0 invariant mass vs. eta. The fit, described in the text, is performed in several bins in eta. The reconstructed mass is constant within the nominal acceptance of the endcap, and has a value of 139.0 +/- 0.3 MeV. Compare with the accepted 135 MeV. We are approximately 4 MeV, or 3%, too high. Right: For comparison, the invariant mass spectrum in the eta meson mass range. This plot is made under the same conditions as the pi0 spectra (same cuts, pseudorapidity range, etc...) On average the eta reconstructs to 551.3 +/- 3.5 MeV. This is consistent with the published values.
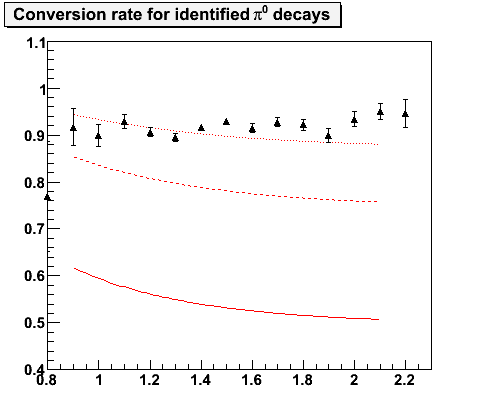
A conversion analysis is performed. Events which satisfy the CPV are counted if they are within the pi0 mass window 110 MeV < M < 170 MeV. This gives the total number of neutral pions which pass the CPV, labeled Ncpv. Of the events which satisfy the CPV, there is a subset which register energy in the 2nd preshower layer. These events are counted as conversions, and labeled Nana. The rate of conversions ε is measured as the number of events which registered energy in the 2nd preshower layer to the number of conversions: ε = Nana/Ncpv. These conversion rates are compared with the expected rates for one (solid line), two (dashed line) or three (dotted line) photons. The conversion rates are consistent with the presence, on average, of one extra photon w/in R<0.3. Note that the 1 or 2 3x3 clusters which are used to determine the energy of the photon pair is an appreciable fraction of the size of the R<0.3 isolation area. Thus, there will be excess energy w/in the pion candidate an appreciable fraction of the time. We will need to account for this to understand our calibration / efficiencies for cross sections.
The conversion rate observed for eta mesons is 91.9% +/- 1.6%. This is consistent with the observed conversion rates of the neutral pions, shown in the plot below.
Figure 3 -- Conversion rate measured by the preshower detectors. Events with a photon pair w/in the mass window 0.11 to 0.17 GeV are counted. The conversion rate is defined as the total number of counts which pass the CPV and register energy in the 2nd preshower layer, divided by the total number of counts which pass the CPV. Three lines are superimposed on the graph, corresponding to the expected conversion rate for one (solid line), two (dashed line) or three (dotted line) photons, based on a mean free path of 0.6873 for normal incidence.
η
The invariant mass spectra for isolated neutral pion and eta mesons has been analyzed. The fits to the neutral pions show a mass which is 3% higher than the published values. This can be attributed to additional energy from photons coincident on the towers used to determine the energy of the pion. In order to determine systematic uncertainties on prompt photon cross sections, it will be necessary to determine the contribution to the energy of the pion which these additional photons give.
How do we determine this?
The Monte Carlo may give reasonable results here. The question is "what fraction of the energy of a neutral pion is contributed by additional photons in the jet". When posed this way, some uncertainties in the MC response (e.g. the sampling fraction) drop out.
Other concerns?
We need to be worried about the bias in reconstructing the pi0 mass due to the cluster finder... i.e. close spaced clusters getting merged. This is largely a seperate topic.
Fits to invariant mass spectra
The 2-photon invariant mass spectra for events which pass the CPV cut (solid histogram) and events which register energy in the 2nd preshower layer (dashed histogram). The fit to the invariant mass spectrum is a 7-parameter fit with 1 constraint. The fit function is an exponential background plus a double-gaussian. P0-3 are the parameters of the narrow component of the gaussian. P3 is the fraction of the yield which is in the wide gaussian. P4, which is fixed to 2.333, is the relative width of the wide gaussian. The wide gaussian has the same mean as the narrow gaussian. Finally P5 and P6 are the exponetial fit: e^(P5+P6*x).
