Comparison of conversion rates in MC to data, take 1
0. Monte Carlo Data Sample
| Sample | pT min | pT max | weight |
| mit0040 | 2 | 3 | 8.12 |
| mit0041 | 3 | 4 | 7.66 |
| mit0042 | 4 | 5 | 7.00 |
| mit0043 | 6 | 9 | 0.587 |
| mit0044 | 9 | 15 | 0.844 |
1. Event Reconstruction
The pi0 maker is configured with low seed thresholds, since we will be performing isolation and charged-particle cuts on the data which will kill off backgrounds.
No trigger simulation is performed for this analysis (wanted to make sure we had statistics first)...
mEEclusters=new StMyClusterMaker("mEEclusters", mEEanalysis, mMuDstMaker );
mEEclusters->setSmdSeedEnergy( 1.5, 0.0 ); // seed and slope [MeV]
mEEclusters->setSmdMaximumSize(4);
mEEclusters->setSmdMinimumStrips(5);
mEEclusters->setSeedEnergy(2.0);
mEEclusters->setMinimumEnergy(0.5);
mEEpoints=new StMyPointMaker("mEEpoints",mEEanalysis,mEEclusters);
mEEpoints->setSplit();
mEEpoints->setSplitMinimumET(4.5);
2. Event Selection
- Isolation cut: Sum energy w/in R<0.3 of the leading photon in the pair. Require 90% of energy in the tower containing the leading photon.
- CPV cut: Sum energy deposited in preshower-1 w/in R<0.3. Veto events with energy > 0
- Analysis cut: Sum energy deposited in preshower-2 w/in R<0.3. Increment conversion histogram(s) when energy > 0 (3 sigma > ped).
3. Results
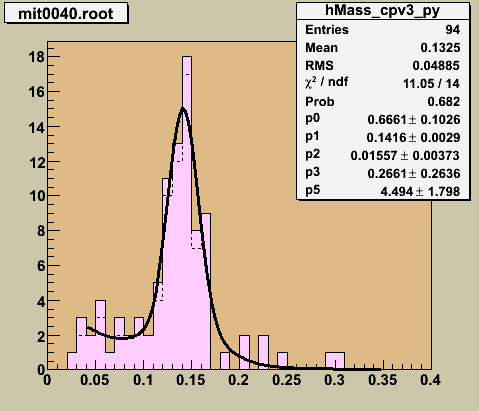
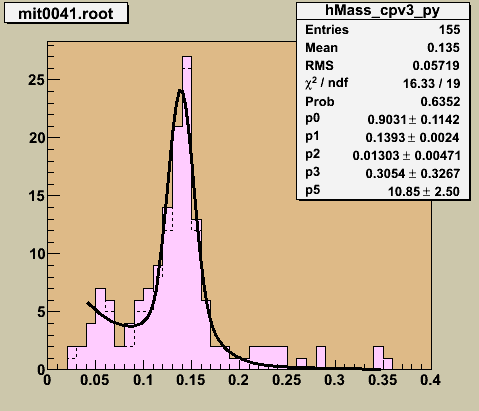
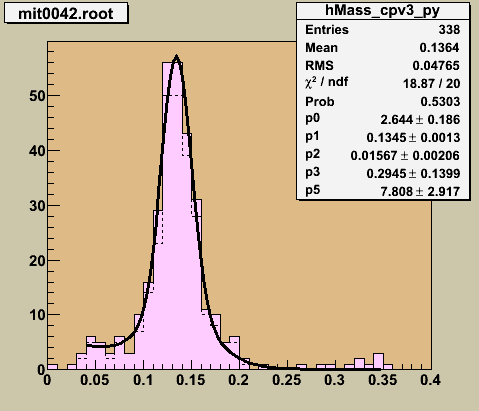
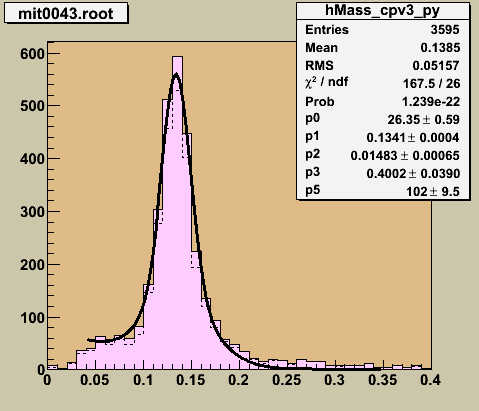
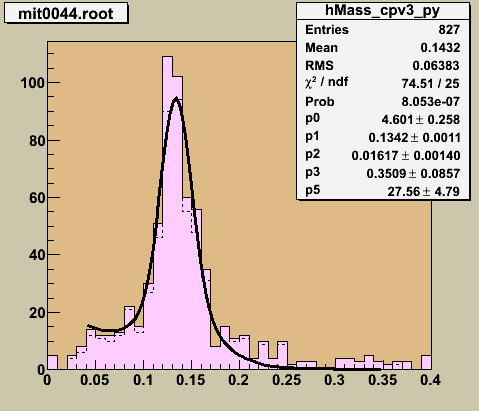
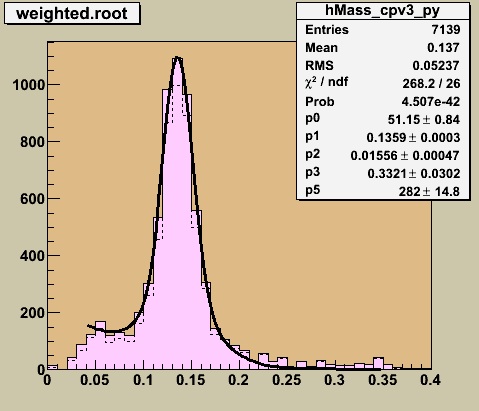
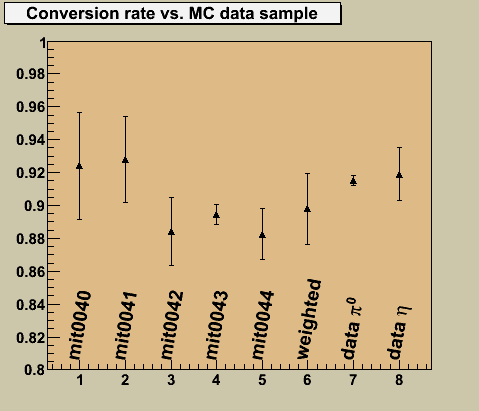
Figure 3.2 -- Conversion rate observed by the 2nd preshower layer for isolated pions, w/in the mass window 110 to 170 MeV. The rate is plotted for the various partonic pT samples, and compared to the values extracted from the data for the pi0 and eta samples.
4. Discussion
The Monte Carlo exhibits a conversion rate which is (nearly) independent of which partonic pT bin it arises from. This suggests that we are "ok" to ignore trigger simulation for the moment... (will include it in the a future study). In the data, both the pi0 and eta event samples show similar conversion rates to the simulate pi0s.
- jwebb's blog
- Login or register to post comments