Comparison of conversion rates in MC to data, take 2
Abstract: We compare the conversion rate for simulated π0 events in the 1st radiator of the endcap to data. We find a conversion rate of 88% +/- 4% for the simulation, compared with 91.5% +/- 0.3% for the data, where we count any signal w/in R<0.3 of the pion candidate as a conversion.
0. Monte Carlo Data Sample
| Sample | pT min | pT max | weight |
| mit0040 | 2 | 3 | 8.12 |
| mit0041 | 3 | 4 | 7.66 |
| mit0042 | 4 | 5 | 7.00 |
| mit0043 | 6 | 9 | 0.587 |
| mit0044 | 9 | 15 | 0.844 |
1. Event Reconstruction
The pi0 maker is configured with low seed thresholds, since we will be performing isolation and charged-particle cuts on the data which will kill off backgrounds.
Trigger simulation
- Use StTriggerUtilities for trigger simulation
- Timestamp: dbMk->SetDateTime(20060522, 55000); // timestamp R7142018
- Simulate trigger ID 137641 (n.b. this is only one of the triggers used in the data... need another pass at this)
2. Event Selection
- Isolation cut: Sum energy w/in R<0.3 of the leading photon in the pair. Require 90% of energy in the tower containing the leading photon.
- CPV cut: Sum energy deposited in preshower-1 w/in R<0.3. Veto events with energy > 0
- Analysis cut: Sum energy deposited in preshower-2 w/in R<0.3. Increment conversion histogram(s) when energy > 0 (3 sigma > ped).
3. Results
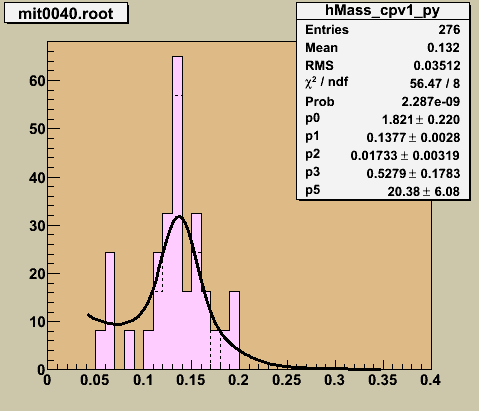
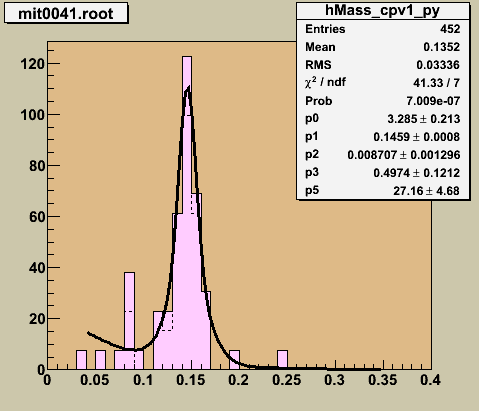
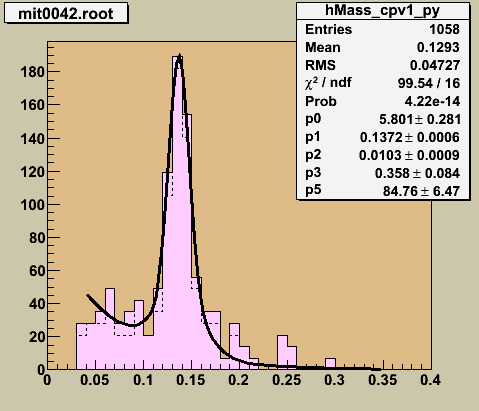
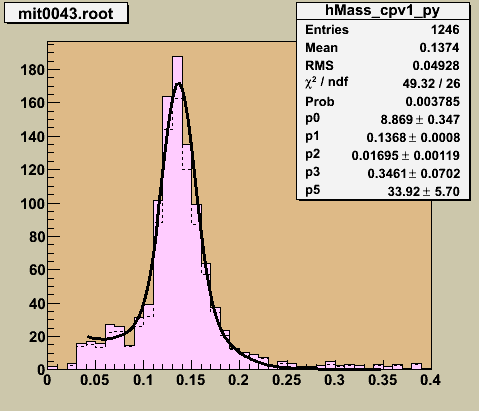
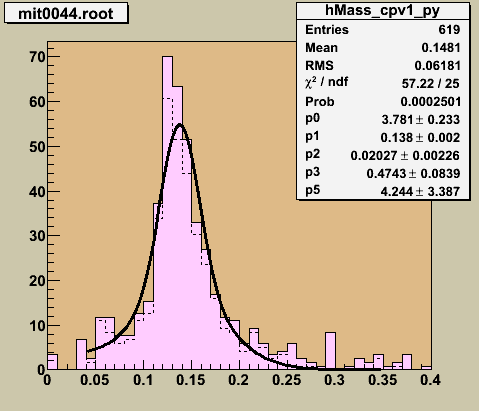
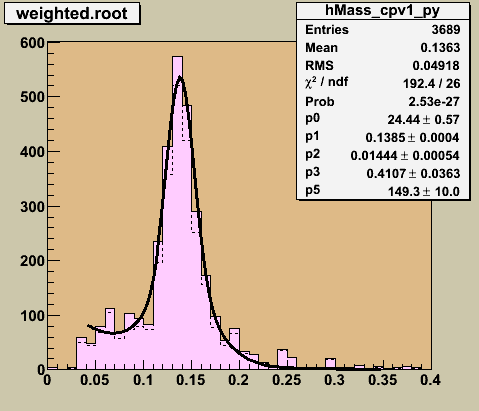
Figure 3.2 -- Conversion rate observed by the 2nd preshower layer for isolated pions, w/in the mass window 110 to 170 MeV. The rate is plotted for the various partonic pT samples, and compared to the values extracted from the data for the pi0 and eta samples.
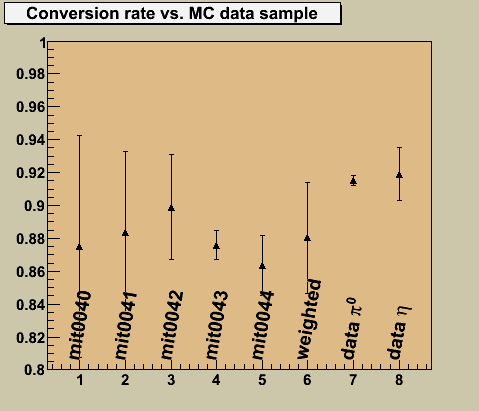
4. Discussion
The Monte Carlo exhibits a conversion rate which is (nearly) independent of which partonic pT bin it arises from. This suggests that we are "ok" to ignore trigger simulation for the moment... (will include it in the a future study). In the data, both the pi0 and eta event samples show similar conversion rates to the simulate pi0s.
Alice has examined the background conversion rates for events which pass gamma ID cuts. Her study showed a lower conversion rate than what we are seeing for pi0 decays. While her study used tighter gamma ID cuts than mine, I suspect that these results indicate that π0 decays are not going to be a good surrogate to determine the background conversion rates in prompt photon samples. That being said, I still need to check the following:
- jwebb's blog
- Login or register to post comments