- jwebb's home page
- Posts
- 2019
- 2018
- 2017
- 2016
- 2015
- 2014
- 2013
- November (1)
- October (1)
- September (1)
- July (1)
- June (1)
- April (1)
- March (3)
- February (1)
- January (1)
- 2012
- 2011
- December (2)
- September (3)
- August (5)
- July (6)
- June (6)
- May (1)
- April (5)
- March (5)
- February (2)
- January (2)
- 2010
- December (3)
- October (3)
- September (2)
- August (2)
- June (2)
- May (4)
- April (4)
- March (2)
- February (4)
- January (10)
- 2009
- 2008
- 2007
- 2006
- July (1)
- My blog
- Post new blog entry
- All blogs
The Notch
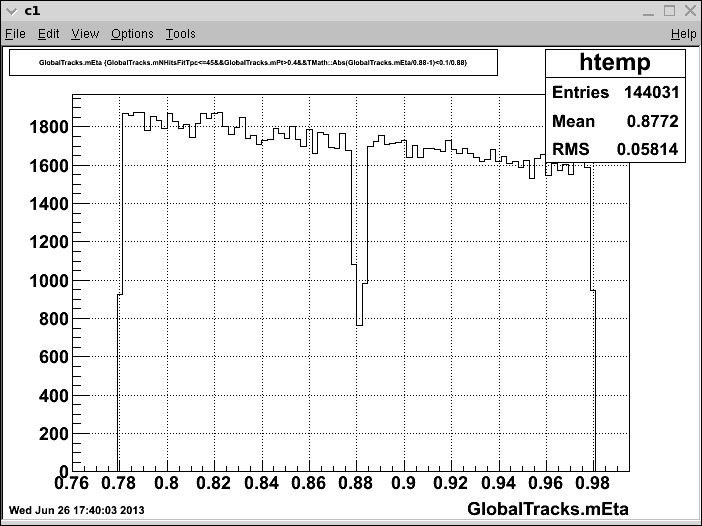
The "notch" in pseudorapidity is pronounced, and fairly precisely centered on eta=0.88 --

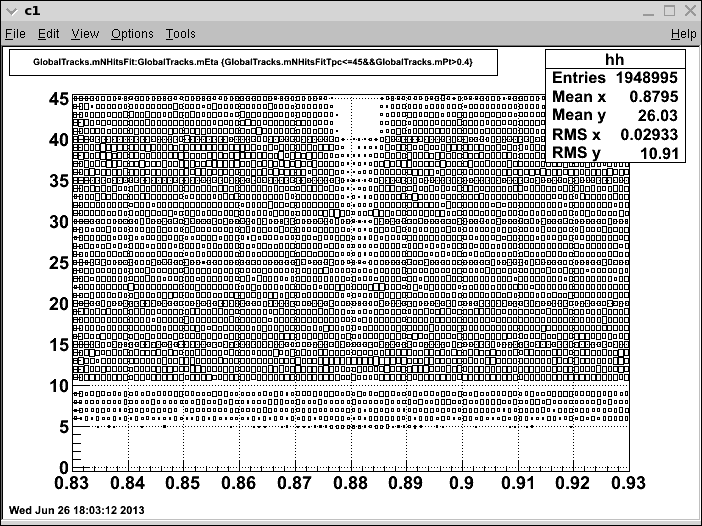
Plot number of hits fit vs eta (zooming in on 0.83 to 0.93 now...). We are missing tracks with N fit points > 40 entirely in this region.

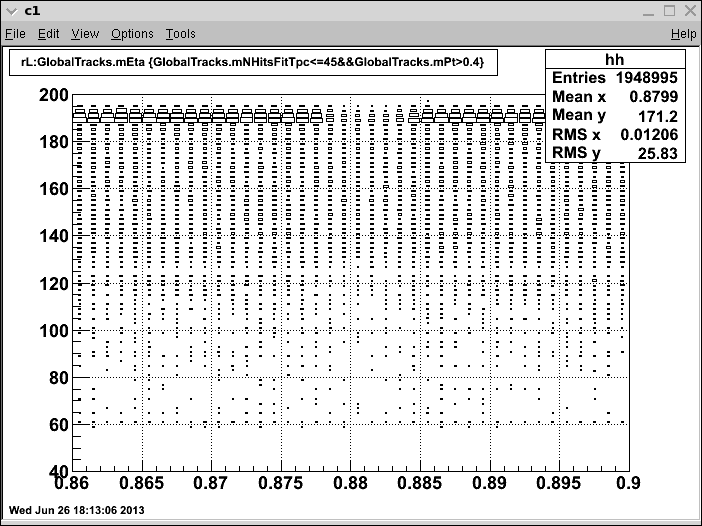
We zoom in again, to 0.86 < eta < 0.90, and this time plot the radius of the last hit on the track (a.k.a. the first point on the seed) vs eta. Here we see that there is a class of events which is depleted for Rlast > 190 or so.

chain->Draw("GlobalTracks.mEta","GlobalTracks.mNHitsFitTpc<=45&&GlobalTracks.mPt>0.4&&TMath::Abs(GlobalTracks.mEta/0.88-1)<0.1/0.88","")

Plot number of hits fit vs eta (zooming in on 0.83 to 0.93 now...). We are missing tracks with N fit points > 40 entirely in this region.
chain->Draw("GlobalTracks.mNHitsFit:GlobalTracks.mEta>>hh(100,0.83,0.93,46,-0.5,45.5)","GlobalTracks.mNHitsFitTpc<=45&&GlobalTracks.mPt>0.4","")

We zoom in again, to 0.86 < eta < 0.90, and this time plot the radius of the last hit on the track (a.k.a. the first point on the seed) vs eta. Here we see that there is a class of events which is depleted for Rlast > 190 or so.
chain->Draw("rL:GlobalTracks.mEta>>hh(40,0.86,0.90,80,40.,200.)","GlobalTracks.mNHitsFitTpc<=45&&GlobalTracks.mPt>0.4","box")

Groups:
- jwebb's blog
- Login or register to post comments
